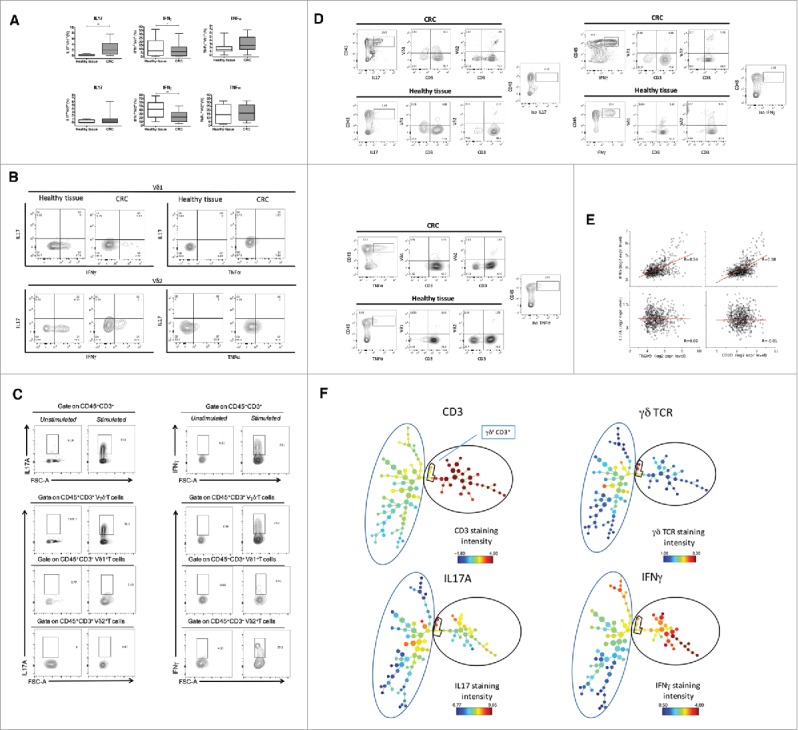
Figure 2.

Cytokine production of tumor infiltrating γδ T cells. (A) Box plots of cumulative data of healthy tissue and tumor tissue samples from 20 CRC patients. Cells were stimulated in vitro as described in Materials and Methods and were stained with mAbs to IFN-γ, IL-17 and TNF-α. *p<0.05 and **p<0.01 performed by nonparametric Mann-Whitney test, unpaired and 2-tailed with confidential interval 95%. (B) Flow cytometry analysis of healthy and tumor tissue from one representative CRC patient. (C) Representative dot plots to define IL-17 or IFN-γ producing γδ, Vδ1 and Vδ2 T cells gated separately on CD45+ CD3+γδ−, CD45+ CD3+ Vδ1+ or CD45+ CD3+ Vδ2+ T cells. (D) Representative dot plots to define cells making IL-17 or IFN-γ upon gating on CD45+ IL-17+ or CD45+ IFN-γ+ cells, of healthy and tumor tissue. (E) Pearson correlation of TCR, IFNG and IL17A gene expression levels in n = 585 CRC tumor samples.**p<0.01. (F) CRC-infiltrating CD45+ single cells were used to generate the SPADE tree, and were grouped in 2 different populations, CD3− and CD3+(black outer circles). The distribution of the major populations is showed for one representative sample. The branching tree is based on the number of cells included in each node and the legend indicates the range of cell per node according to relative median fluorescence intensity.
