
Figure 7.
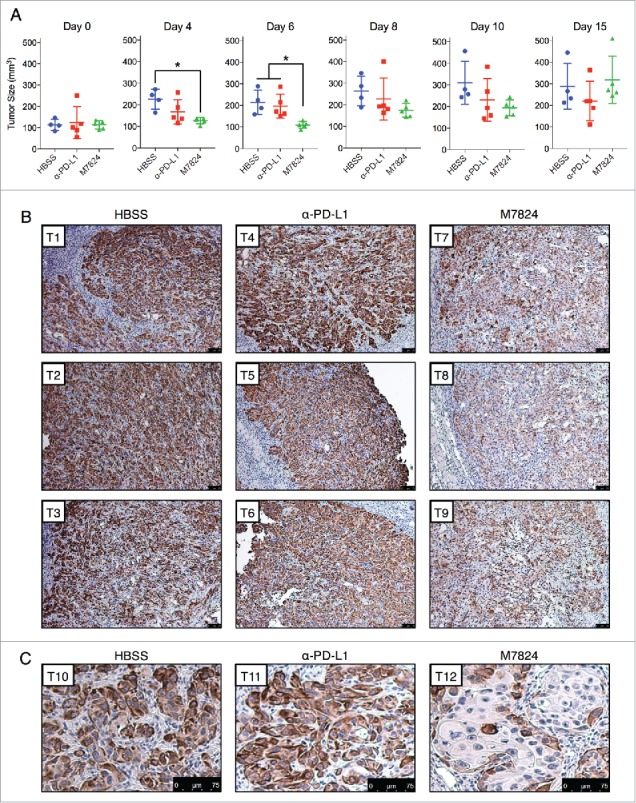
M7824 reverts TGF-β1-induced mesenchymal features in vivo. (A) Measurements of tumor size for the HCC4006 xenografts at various time points. *, p < 0.05. (B) Representative IHC staining for vimentin expression from 3 tumors per treatment group. Scale bar = 75 μm. (C) Magnified view of representative IHC staining for vimentin expression from a fourth tumor from each treatment group. Scale bar = 75 μm.