
Figure 1.
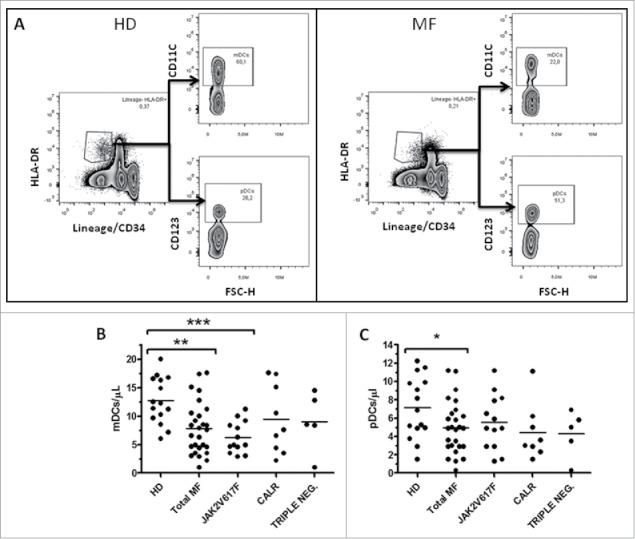
Reduced circulating mDCs in JAK2(V617F) mutated patients. A) Representative example of the gating strategy used to determine, in HD (left panels) and MF patients (right panels), the percentages used to calculate the circulating level of mDCs (identified as Lin−HLA-DR+CD11c+ cells) and pDCs (identified as Lin−HLA-DR+CD123+ cells). Circulating number of mDCs (B) and pDCs (C) in HD (n = 17), total MF (n = 27), JAK2(V617F) mutated (n = 13), CALR mutated (n = 9) and triple negative (n = 5) patients are shown; cell concentrations were calculated as follows: (percentage of positive cells) x (white blood cell count)/100. For all graphs one symbol represents one individual, and the height of the bar represents the mean (*p ≤ 0.05, **p ≤ 0.01, (***p ≤ 0.001).