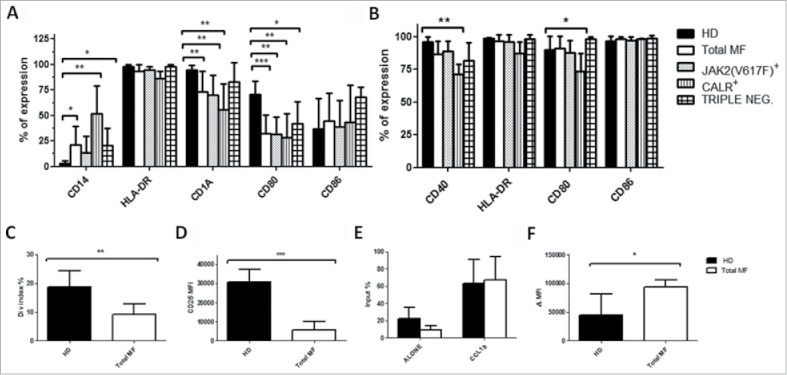
Figure 2.

Impaired DCs differentiation capacity of monocytes from MF patients. Immature (A) and mature (B) mo-DCs phenotype from HD (n = 10) total MF (n = 16), JAK2(V617F) mutated (n = 7), CALR mutated (n = 5) and triple negative (n = 4) patients. The expression of HLA-DR, CD14, CD1a, CD40, CD80 and CD86 was evaluated by flow cytometry. Histograms represent the mean percentage of expression ± SD; C) ability of mo-DCs from HD (n = 8), total MF (n = 8) to prime allogeneic T-cell responses in vitro. mo-DCs were cultured with allogeneic Tresp (mo-DCs/Tresp ratio 1:10) labeled with CFSE. The assays were performed over a period of 5 days and T cell proliferation was evaluated by division index. Histograms represent the mean ± SD of the division index expressed as percentages; D) mo-DCs were cultured with allogeneic Tresp (mo-DCs/Tresp ratio 1:10) labeled with CFSE. The assays were performed over a period of 5 days and CD25 expression was evaluated by flow cytometry. Histograms represent the mean MFI ± SD of CD25 from HD (n = 8) and total MF (n = 8) to prime allogeneic T-cell responses in vitro; E) evaluation of spontaneous and toward CCL19 (400 ng/mL) mature mo-DCs migratory capacity in HD (n = 6) and MF patients (n = 8). 1 × 10⁵ cells were seeded in a transwell chamber (diameter 6.5 mm, pore size 8 µm) for 4 hours. The amount of migrated cells is expressed as a percentage of the input: (number of migrated cells in the lower compartment/loaded cells in the upper compartment) X 100. Histograms represent the mean ± SD of the input; F) Immature mo-DCs dextran uptake in HD (n = 6) and MF patients (n = 8). Cells were incubated for 30 min at 37°C or on ice (used as a background control). After washing, fluorescence was analyzed by flow cytometry. Uptake of FITC-dextran was expressed as delta (Δ) mean fluorescence intensity (MFI): MFI (uptake at 37°C) – MFI (uptake on ice). Histograms represent the mean ± SD of dextran uptake (* p ≤ 0.05, ** p ≤ 0.01, *** p ≤ 0.001).
