
Figure 3.
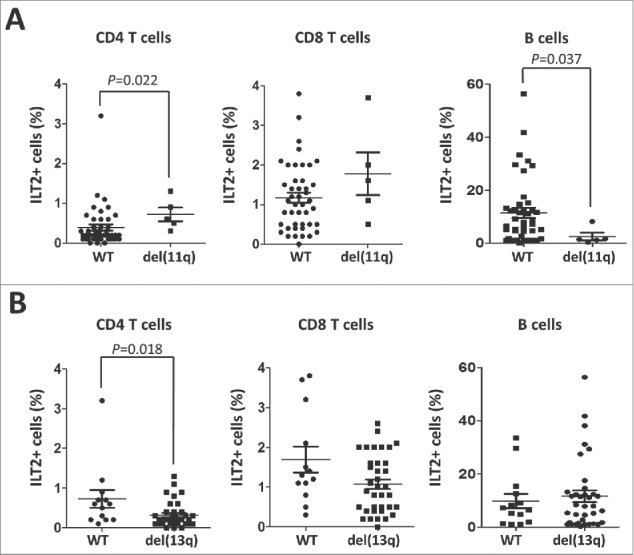
ILT2 expression correlates with cytogenetic abnormalities that are markers of the progression of the disease. (A) Comparison between ILT2+ CD8 T cells, ILT2+ CD4 T cells, and ILT2+ B cells from CLL patients stratified by the presence of chromosome 11q deletion. Horizontal bars represent the mean ± SEM. (B) The comparison between ILT2+ CD4 T cells, ILT2+ CD8 T cells and ILT2+ B cells from CLL patients with or without chromosome 13q deletion is shown.