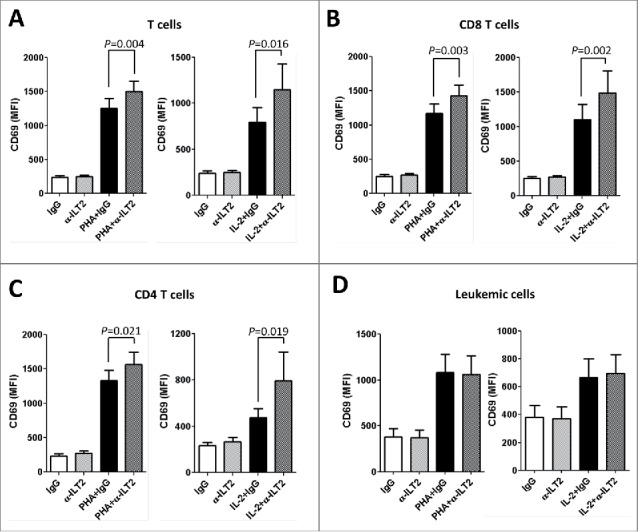
Figure 5.

ILT2 blockade promotes T-cell activation. Flow cytometry analyses were conducted to evaluate the expression of CD69 in PBMCs from 14 CLL patients stimulated with IL-2 (50 U/mL) or PHA (5 µg/mL) and incubated in the presence of anti-ILT2 blocking antibody or irrelevant IgG1 (10 μg/mL) for 48 hours. The figure shows the comparison between the surface expression of CD69 detected on T cells (A), CD8 T cells (B), CD4 T cells (C) and leukemic cells (D) from CLL patients. Bars represent the mean MFI of CD69 ± SEM for each condition.
