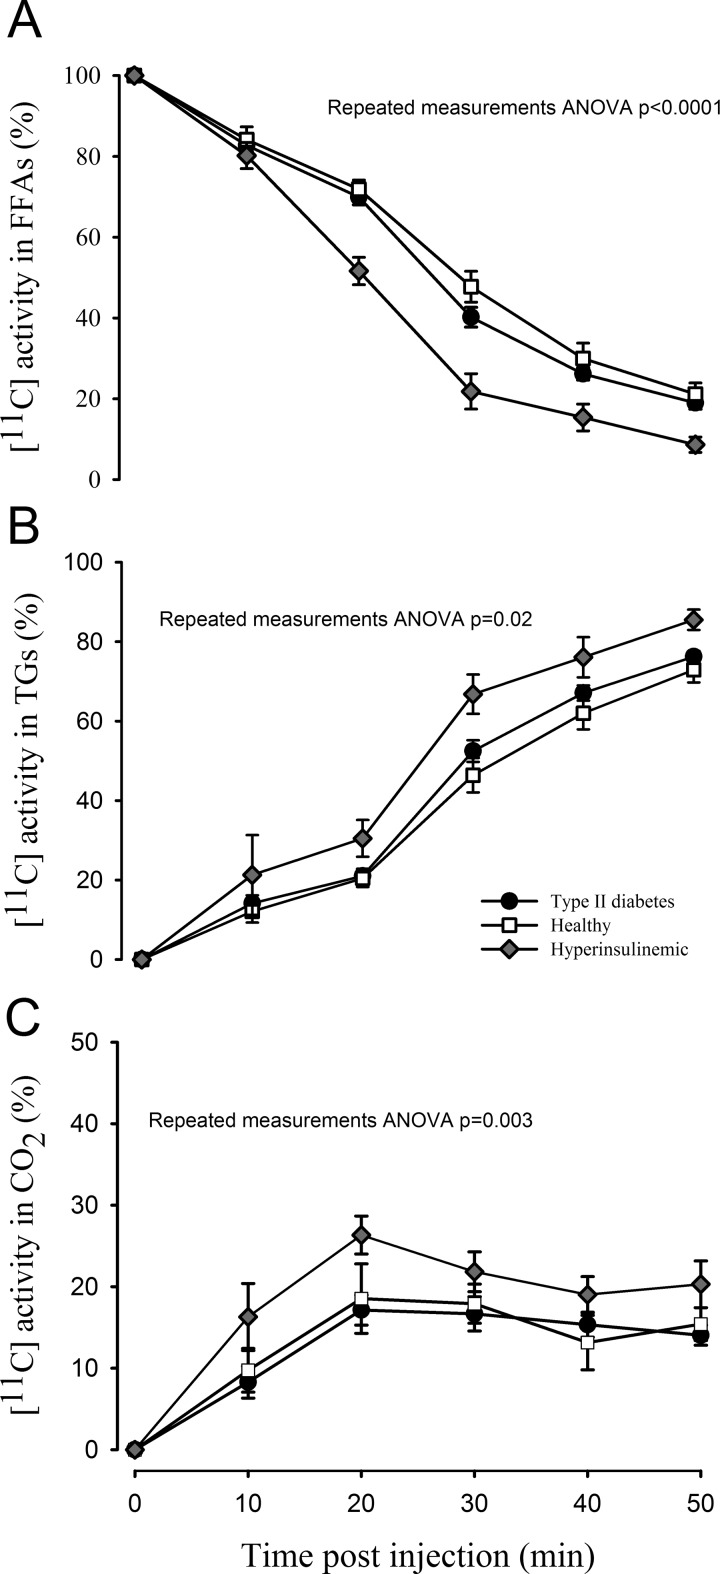
Figure 2.
Metabolite correction of palmitate at 5 different time points during a 50-minute dynamic PET scan. A, The amount of radioactivity present as FFAs measured with the SPE method. A repeated measures ANOVA showed significantly lower activity in the FFA fraction in hyperinsulinemic patients (mixed model repeated measures ANOVA [group] P <.0001, [group vs time interaction] P < .0001). There was no difference in time-activity curves between healthy controls and patients with T2D (mixed model repeated measures ANOVA [group] P = .14, [group vs time interaction] P = .39). B, [11C] activity in complex lipids (mainly TGs) measured by the SPE method. Significantly more activity was present in this fraction during hyperinsulinemia (ANOVA [group] P = .02), whereas no difference was detected between controls and T2D (ANOVA [group] P = .17). C, Radioactivity detected in the CO2 fraction, with significantly more in patients during hyperinsulinemia (ANOVA [group] P = .003) and no difference between T2D and controls (ANOVA [group] P = .72). Error bars represent ± standard errors. ANOVA indicates analysis of variance; FFAs, free fatty acids; PET, positron emission tomography; SPE, solid-phase extraction; T2D, type 2 diabetes; TG, triglyceride.

