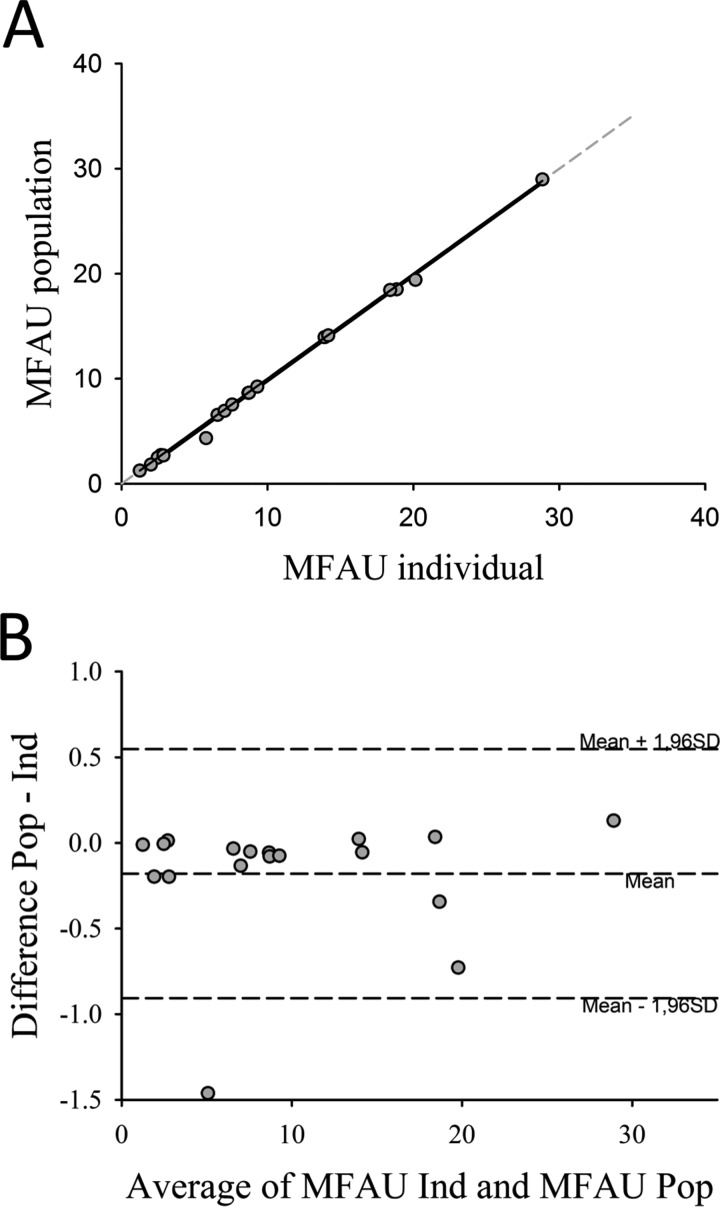
Figure 4.
Results from the cardiac image analysis in 9 healthy controls (from study 3), in which 2 PET scans were performed 3 months apart. A, Correlation between individual (ind) and population-based (pop) (results obtained from study 2) metabolite correction methods for measuring MFAU (n = 18). Pearson correlation coefficient r = .999, P < .001. Regression line equation: y = −0.200 + 1.002x. B, Bland-Altman plot. The middle dashed line represents the average difference between the 2 methods; the upper and lower dashed lines represent limits of agreement (mean [1.96 SD]). MFAU indicates myocardial fatty acid uptake; PET, positron emission tomography; SD, standard deviation.

