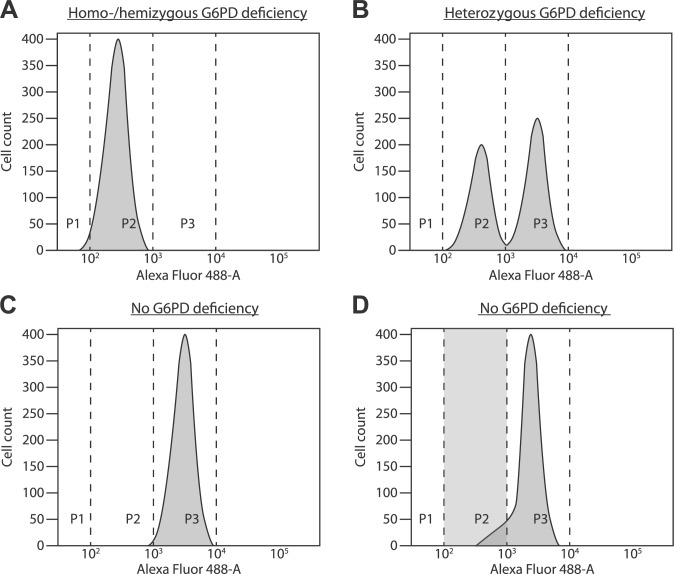
Figure 1.
(A) Fluorescence distribution patterns after cytofluorometric analysis of G6PD activity in RBCs of a homozygous or hemizygous G6PD-deficient individual. All RBCs have a low fluorescence intensity (region P2). (B) Heterozygous G6PD deficiency. One population of RBCs has a low fluorescence intensity (region P2), and another one has a high fluorescence intensity (region P3). (C) Healthy individual without G6PD deficiency. The majority of RBCs have a high fluorescence intensity (region P3). Only a few old RBCs with low G6PD activity are found in region P2. (D) Healthy individual with an asymmetric population of RBCs with a high fluorescence intensity (intensity in region P3 and a shoulder in region P2). A substantial amount of RBCs with low fluorescence intensity are localized in region P2. Without proper visual inspection of the figure, this patient is falsely classified as heterozygously G6PD deficient. Abbreviations: G6PD, glucose-6-phosphate dehydrogenase; RBCs, red blood cells.

