Figure 3.
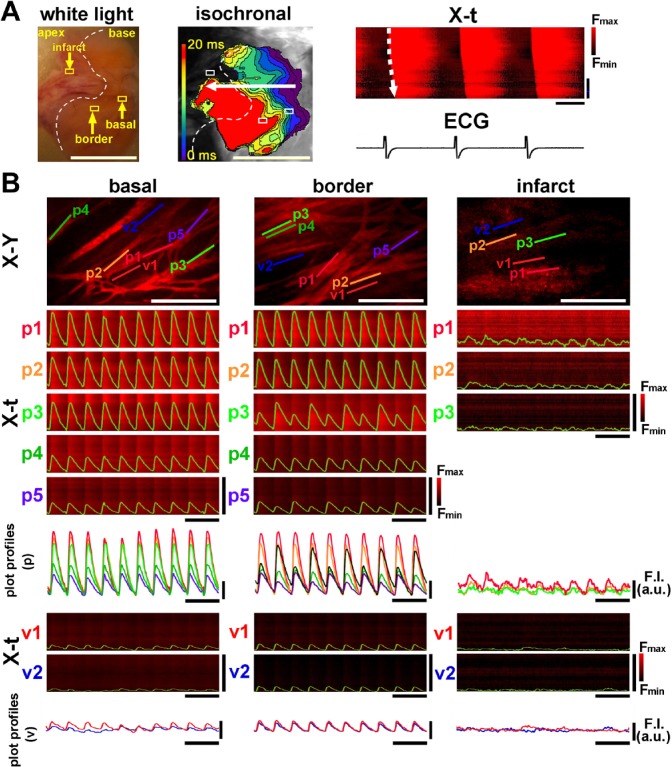
[Ca2+]i dynamics of the 3-day-old infarcted heart. (A) A mesoscopic white-light image obtained from the endocardial surface of the left ventricular septum (left panel). A pale, tan-colored area bordered by the white dotted line denotes the infarcted lesion. The isochronal propagation map of the corresponding endocardial surface (middle) and the X-t images of [Ca2+]i dynamics with ECG trace (right) show slowing of impulse propagation on the infarct border zone. White scale bars = 5 mm, horizontal bars in X-t = 200 msec, and vertical bars in X-t = 5 mm. (B) [Ca2+]i dynamics of Purkinje fibers and subjacent ventricular myocytes viewed by rapid-scanning confocal microscopy. The fluo4-fluorescence X-Y images of the basal zone, infarct border zone (middle area), and infarct (apical area) and the corresponding X-t images of the five individual Purkinje fibers (p1–p5). As shown in the three X-t images on the infarct zone (p1–p3), ventricular myocytes (v1 and v2) subjacent to the Purkinje fiber networks show nearly indiscernible Ca2+ transients. White scale bars in X-Y images = 200 µm, horizontal black bars for X-t image = 1 sec, and vertical bars for X-t image = 100 µm. Abbreviation: ECG, electrocardiogram.

