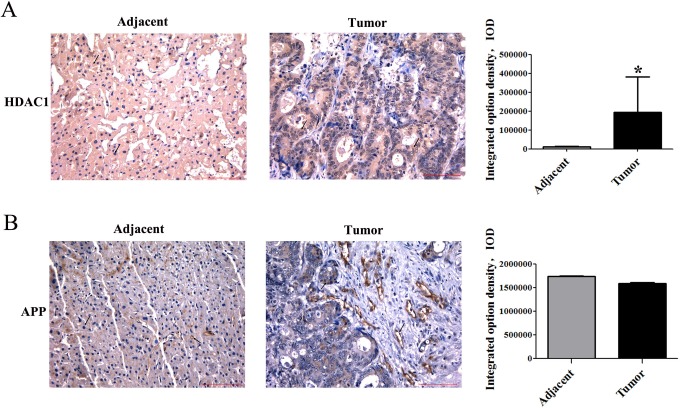
Figure 6.
Immunohistochemical stainning of APP and HDAC1 at 00467 HCC patient. (A-B) Immunohistochemical analysis of HDAC1 and APP in the adjacent tissues and tumor tissues at 00467 specimen. Magnification 200×, scale bars represent 100 μm. (A) Statistics of HDAC1 expression in HCC tissues and the adjacent tissues (*P < 0.05). (B) Statistics of APP expression in HCC tissues and the adjacent tissues.

