
Figure 3.
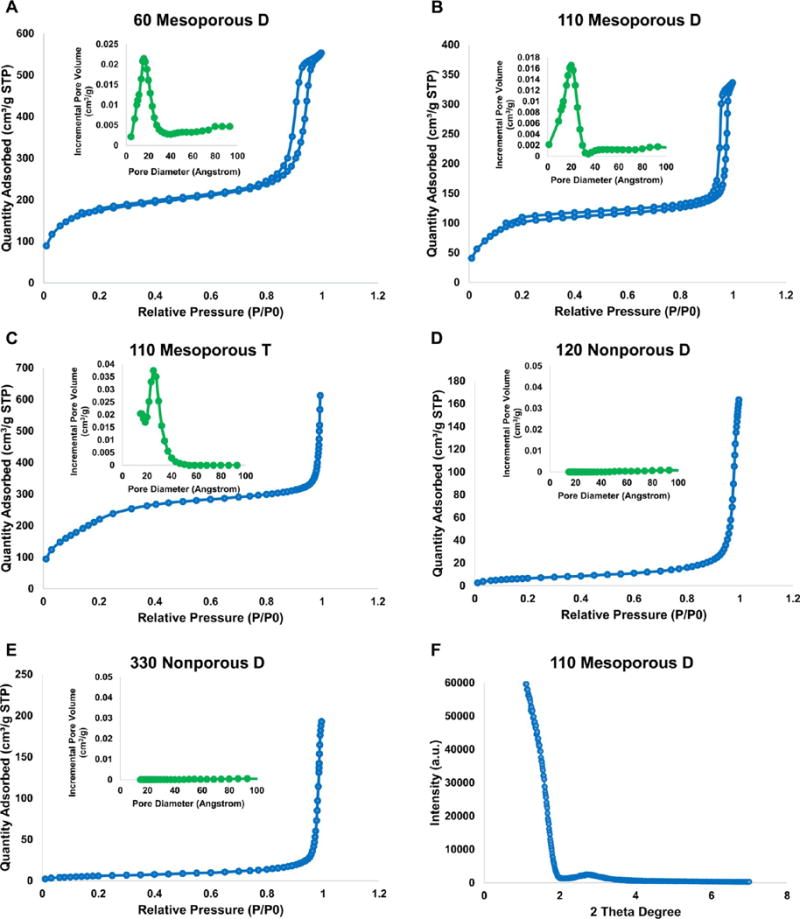
Nitrogen adsorption–desorption isotherms: (A) 60 Mesoporous D; (B) 110 Mesoporous D; (C) 110 Mesoporous T; (D) 120 Nonporous D; and (E) 330 Nonporous D. On the basis of IUPAC classification, isotherms in A–C indicate mesoporous structure, while those in D and E are associated with nonporous structure. Green insets are pore diameter distribution plots for each nanoparticle in angstrom. (F) XRD graph of 110 Mesoporous D nanoparticles does not show the typical Bragg peaks and confirms the disordered pore structure of these nanoparticles.