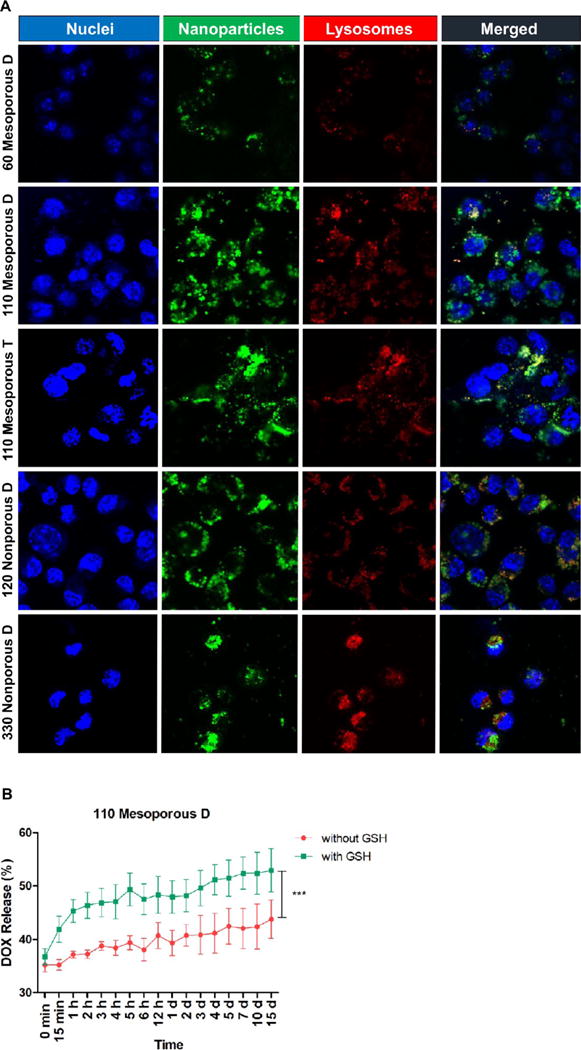
Figure 8.

(A) CLSM images showing co-localization of 80 μg mL−1 nanoparticles after 24 h of incubation in RAW 264.7 macrophages. Nuclei were stained in blue with Hoechst 33342 dye. Nanoparticles appear with the green fluorescence of FITC. Lysosomes were stained in red via LysoTracker Deep Red dye. As shown, nanoparticles accumulated in the endolysosomal compartments and in the perinuclear regions. (B) DOX release from 110 Mesoporous D nanoparticles. The amount of release in the presence of GSH was significantly higher than that in the absence of GSH. Data are mean ± SD (n = 3). ***, statistically significant difference between the two study groups (Pvalue < 0.001).
