
Figure 3.
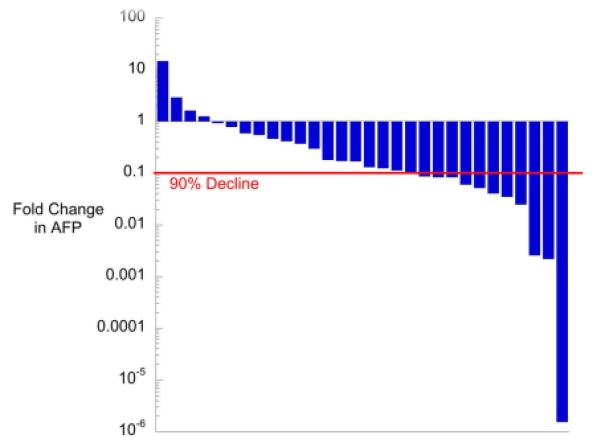
AFP Decline After 2 Cycles of VI Therapy Shown are the changes in AFP derived as [(initial measurement-final measurement)/initial measurement] plotted on a log-scale. The red line represents a 90% decline in alphafetoprotein between patient enrollment and the end of the 2 cycles of VI therapy. Ninety percent decline represents an alphafetoprotein response as defined in the protocol.