Figure 2.

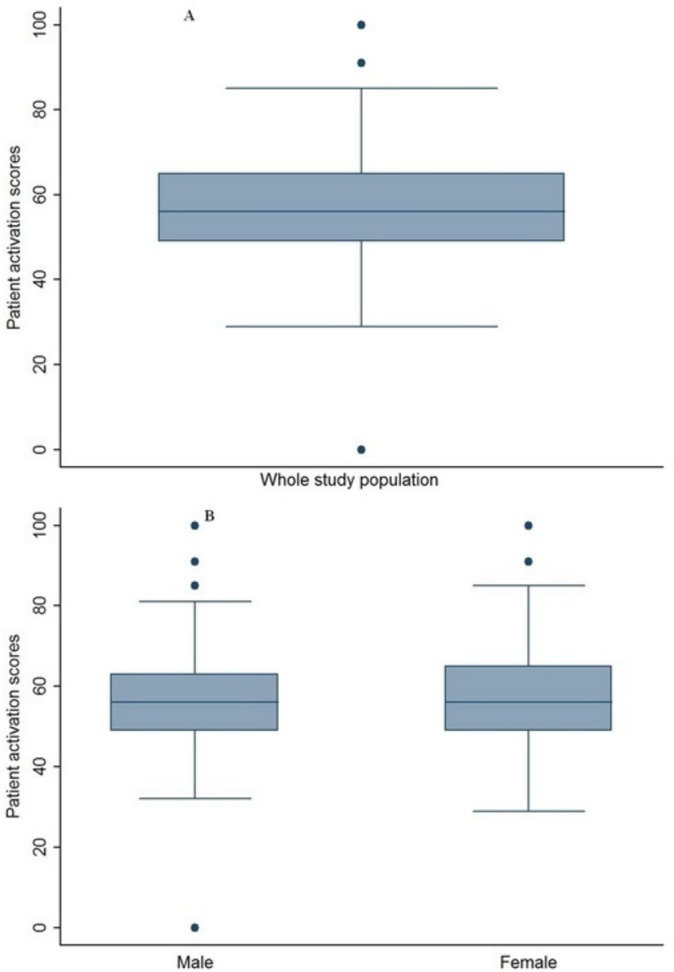
Patient activation. Distribution of patient activation from (A) the study population (mean 57.6, SD 15.5) and (B) male (mean 57.4, SD 16.0) and female patients (mean 58.1, SD 14.4).

Patient activation. Distribution of patient activation from (A) the study population (mean 57.6, SD 15.5) and (B) male (mean 57.4, SD 16.0) and female patients (mean 58.1, SD 14.4).