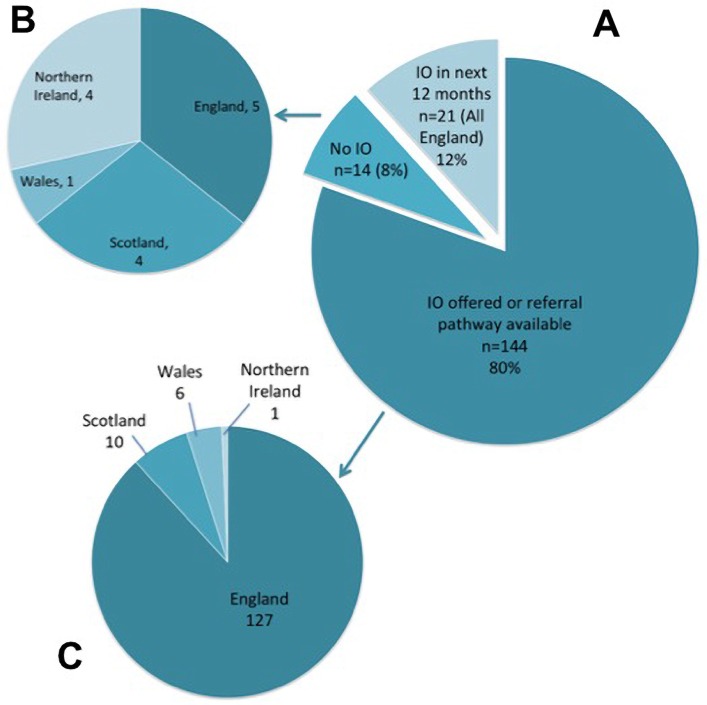
Figure 2.
Middle pie chart (A) displaying total number/percentage of trusts which offer interventional oncology (IO) or have a referral pathway, number which plan to set up IO service or referral pathway in the next 12 months (all English trusts) and those without any plans to set up an IO service pathway. The top (B) and bottom (C) pie charts display the breakdown of healthcare trusts/health boards by country.

