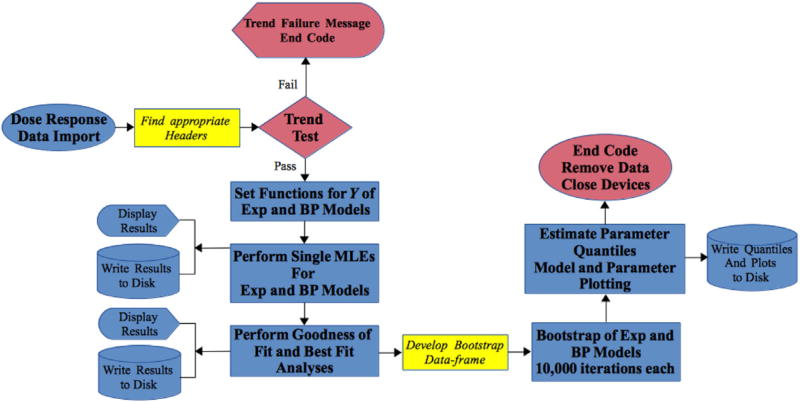
Fig. 1.
Algorithm of underlying dose response optimization R code. Exp refers to the exponential dose response model and BP refers to the beta Poisson dose response model and trend test referes to the Cochran-Armitage trend test. The colours in the figure outline the following: red for paths to purposely end computations and exit code execution, yellow for data import and blue for code functions. (For interpretation of the references to colour in this figure legend, the reader is referred to the web version of this article.)

