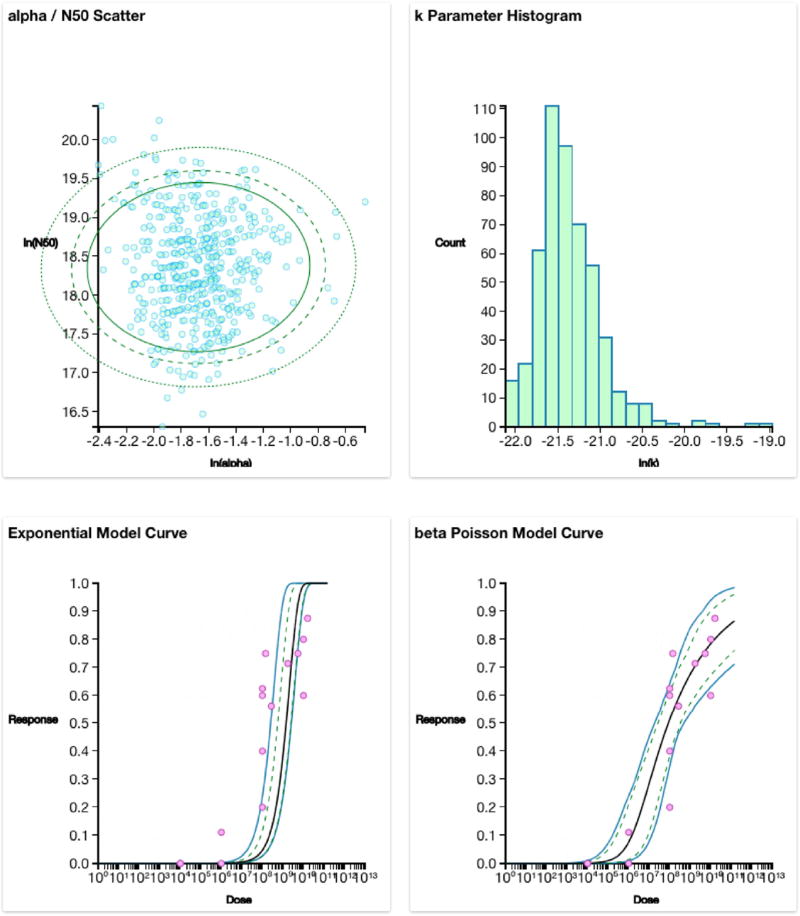
Fig. 9.
Bootstrap plot results, the top plots demonstrate the uncertainty of the parameters after the bootstrap is operated. The top right plot has confidence ellipses for the 90, 95 and 99th percentiles. The bottom plots are the dose response models with confidence intervals (dashed and solid blue lines for 90 and 95th percentiles respectively) around the MLE optimized model (solid black line). The differences seen between these outputs and those seen in Figs. 2 and 5 is that there are 5000 bootstrap iterations for the software and 10,000 for the R code. (For interpretation of the references to colour in this figure legend, the reader is referred to the web version of this article.)

