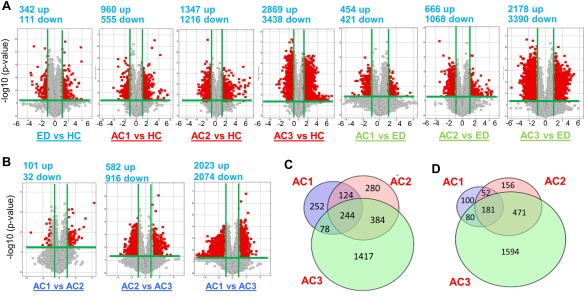
Figure 1.

Volcano plot displaying differentially expressed plasma lncRNAs in three study cohorts of human AC. (A,B) The log2 ratio (x axis) and −log10 adjusted P values (y axis) were plotted in the form of volcano plots for excessive drinkers (ED) versus healthy controls (HC), alcoholic cirrhosis (AC) versus HC, and AC versus ED comparisons. Red color represents significantly up‐regulated (right) and down‐regulated (left) lncRNAs, respectively (FC < 2 or > 2 and adjusted P < 0.05). Gray color represents the significant with small fold change (above the green line) (FC < 1.5 or > 1.5) and the nonsignificant change (below the green line). Total RNAs from 20 human blood samples (n = 4 per group) were analyzed by Arraystar Human LncRNA Microarray version 3.0. AC1 = Child‐Pugh class A, AC2 = Child‐Pugh class B, AC3 = Child‐Pugh class C. (C,D) Venn diagrams showing total numbers and overlapping up‐regulated (C) and down‐regulated (D) lncRNAs between AC1, AC2, and AC3.
