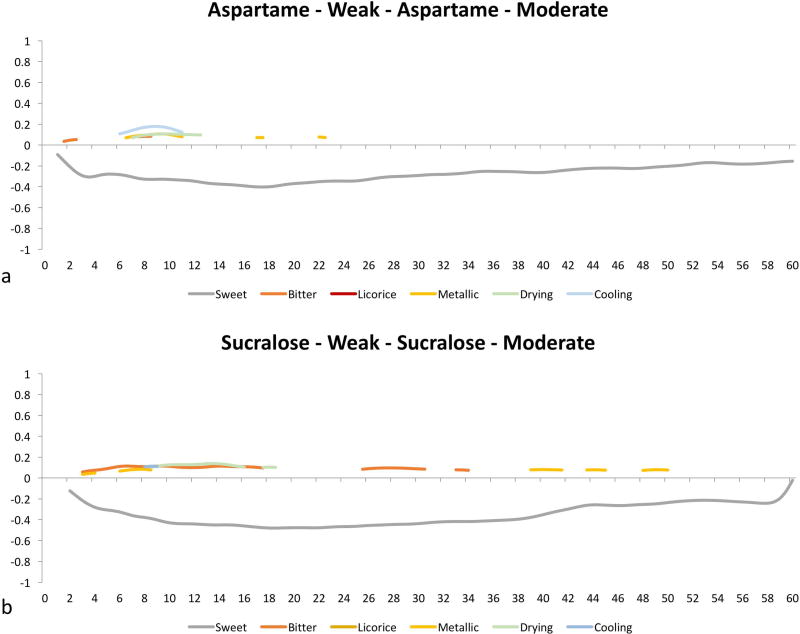
Figure 7.
TCATA difference curves for (a) weak aspartame compared to moderate aspartame and (b) weak sucralose compared to moderate sucralose. TCATA difference curves compare pairs of samples and are plotted by subtracting the citation proportions for each attribute in two samples at each time point.

