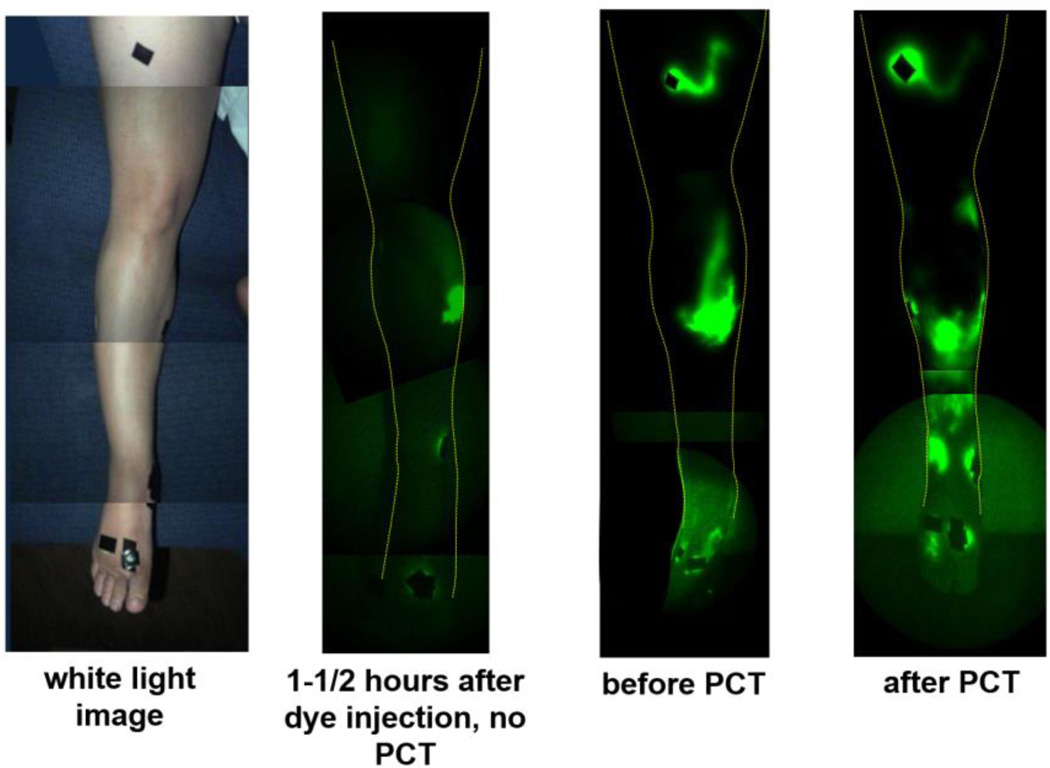
Fig. 3.
Fluorescent dye/lymph distribution in right anterior leg before and after PCT in subject 1. (leftmost) white light image, (second from left) NIRFLI image 1-1/2-2 hours after dye injection, from first imaging session, in which no PCT was performed (18 months prior to second imaging session), (third from left) NIRFLI image before PCT in second imaging session, (rightmost) NIRFLI image after PCT in second session (1-1/2-2 hours after dye injection). Note: full-leg images are montages of smaller regional images.

