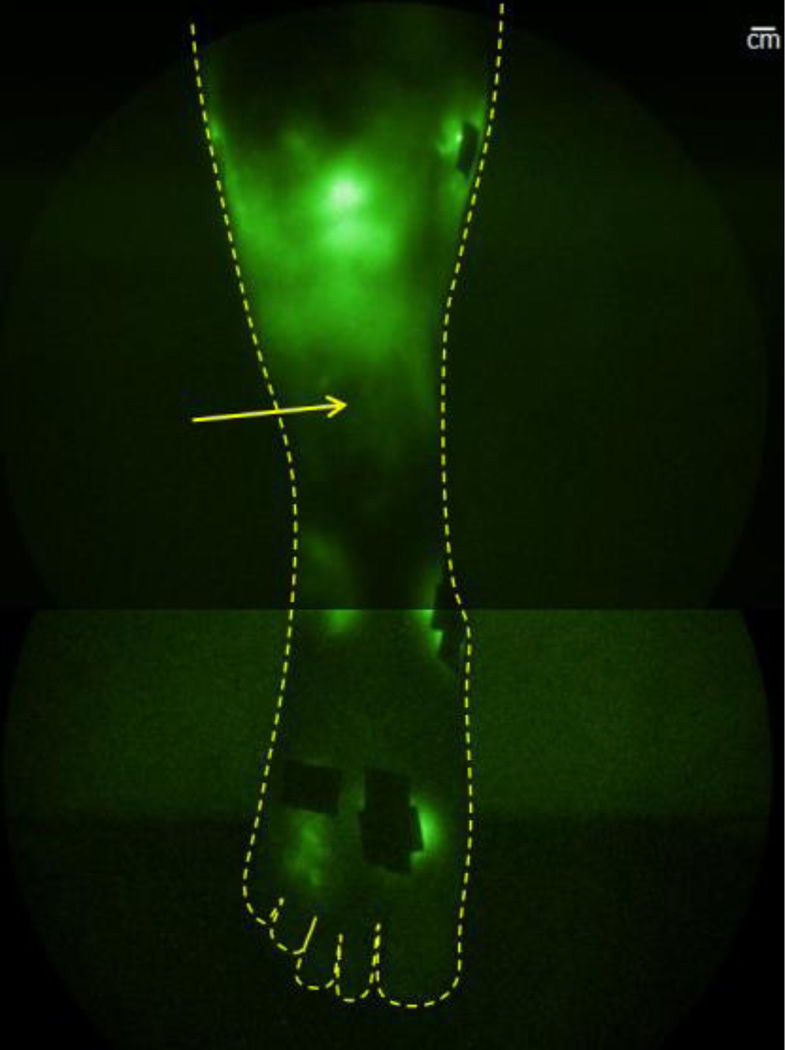
Fig. 4.
NIRFLI image of subject 1’s lower right anterior leg, after PCT treatment. Extravascular/diffuse, as well as primary vessel vascular/linear (small vessels noted by arrow) dye/lymph is visible. Injection sites are covered by small round bandages or small rectangles of black tape to prevent camera saturation. Note: image shown is montage of smaller regional images. Scale bar=1 centimeter.

