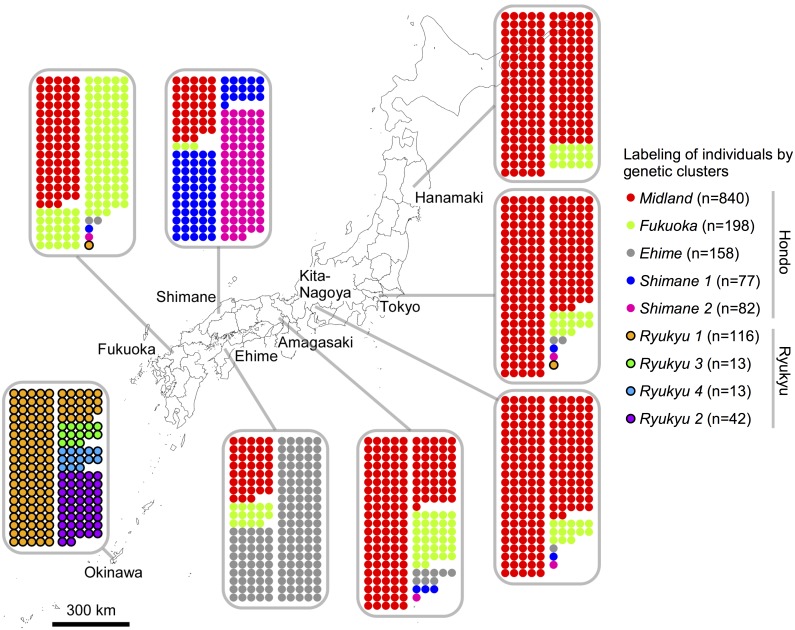
Fig 1. Geographic distribution of the Japanese genetic clusters.
Each population is mapped to its geographic location. The individuals in a population are represented by circles colored according to their assigned genetic clusters. The figure map was generated using the packages maps v3.1.0 and mapdata v2.2–6 in the R software.

