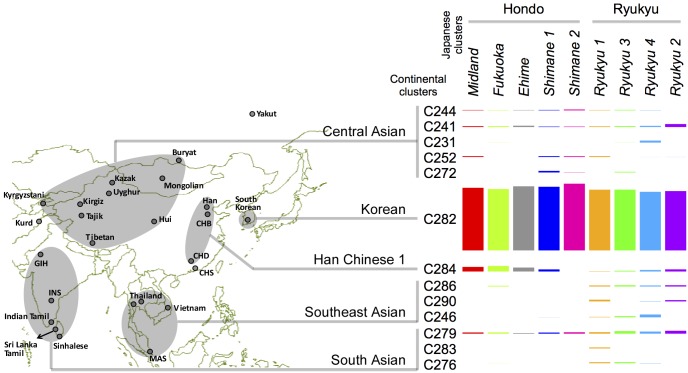
Fig 3. Ancestry profile of the Japanese genetic clusters.
For each Japanese cluster, the non-Japanese genetic components are represented as a mixture of continental Asian clusters. The bar graph indicates the proportion of continental Asian clusters contributing to a given Japanese cluster. Continental Asian clusters with ≥1% contribution to at least one Japanese cluster are shown. The map indicates geographic locations of the populations included in continental Asian clusters. See S4 Table for details. The figure map was generated using the packages maps v2.3–9 and mapdata v2.2–3 in the R software.

