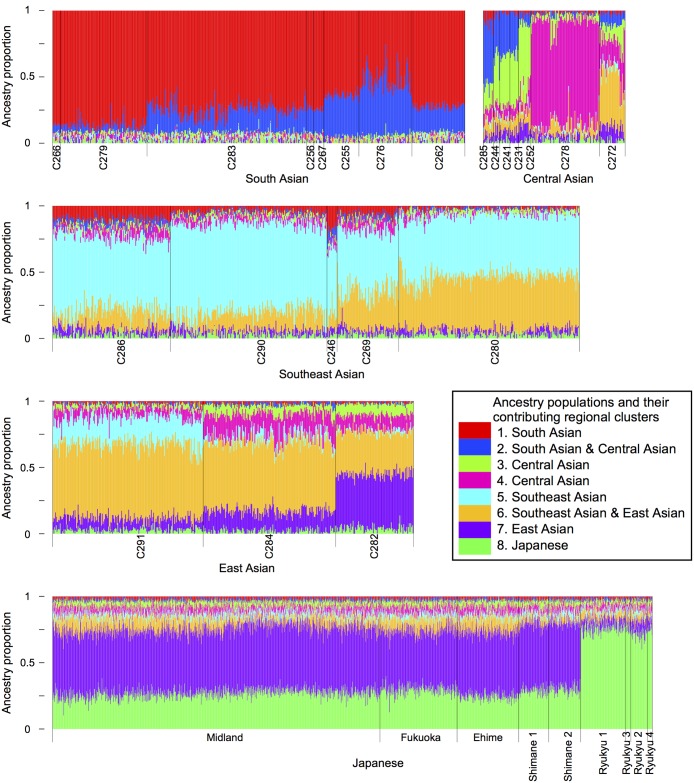
Fig 4. Ancestry populations for the Japanese and continental Asians modeled using the ADMIXTURE program.
Eight ancestry populations are inferred. In this bar plot, each individual is represented by a vertical bar, which is colored by eight segments that indicate the proportion contributed by the corresponding ancestry populations. The individuals are sorted by 23 continental Asian clusters (see S4 Table for details) and nine Japanese clusters. The bar widths are halved for Japanese individuals, to fit the plot in space. The inset shows color-codes for eight ancestry populations and geographic areas of clusters, to which the individual population mainly contributes.

