Fig. 1.
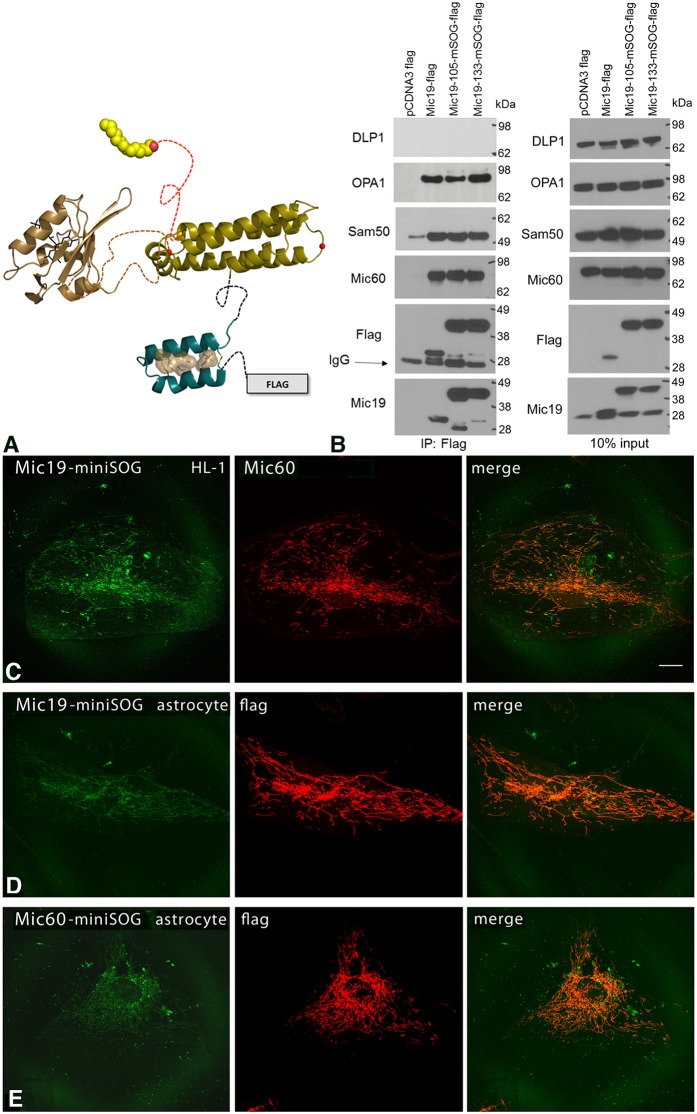
Engineering of Mic19–miniSOG. (A) Two sites were selected for insertion of miniSOG based on our modeling of the Mic19 DUF domain. Residues 105 and 133 are predicted to lie in loops between helices. Phyre2 was used for generating a 3D model of miniSOG (tan) and Mic19. (B) MiniSOG addition at 105 or 133 did not interfere with binding to Mic60, Sam50 or OPA1 in HEK 293 cells expressing Flag-tagged Mic19–miniSOG as determined by immunoprecipitation (IP). Immunoisolated samples were analyzed by SDS-PAGE and immunoblotting (IB) with the indicated antibodies. DLP1 is a negative control. 10% input control is shown on the right. Note that the bottom two Flag blots are also shown in Fig. 8A,B for comparison. (C) MiniSOG constructs of Mic19 and Mic60 correctly trafficked to mitochondria. Left, fluorescence confocal microscopy of Mic19–miniSOG labeling in a HL-1 cell, showing a mitochondrial labeling pattern. Middle, endogenous Mic60 labeling in the same HL-1 cell also showing mitochondrial labeling. Right, overlay of Mic19–miniSOG and Mic60 showing colocalization. Scale bar: 20 μm. (D) Fluorescence confocal microscopy of Mic19–miniSOG (left) and anti-Flag (middle) in a human primary astrocyte, showing mitochondrial labeling; an overlay is on the right. (E) Fluorescence confocal microscopy of Mic60–miniSOG (left) and anti-Flag antibody staining (middle) in a human primary astrocyte, showing mitochondrial labeling; an overlay is on the right. All results are representative of n=3 experiments.

