Fig. 3.
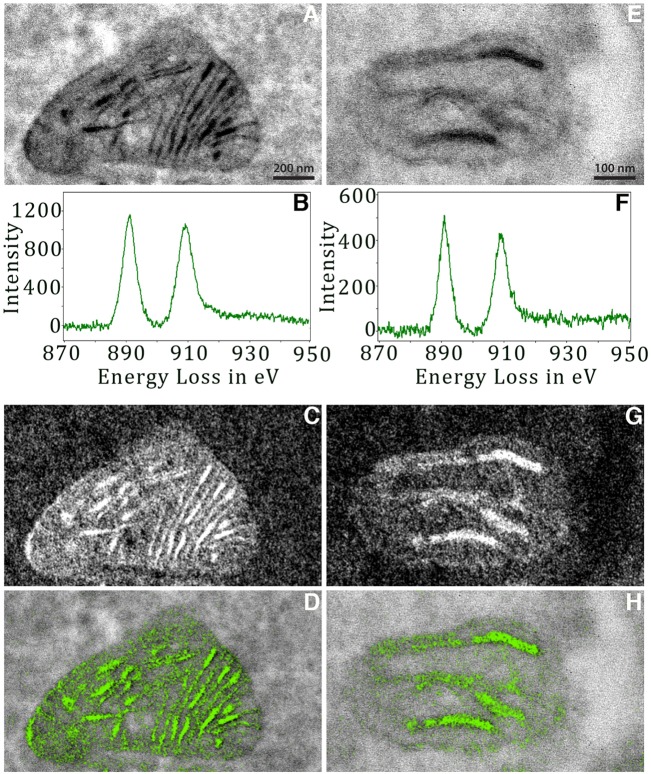
EELS and EFTEM confirm Mic19–miniSOG labeling. (A) TEM image of a large Mic19–miniSOG Ce-DAB-labeled mitochondrion in a HL-1 cell (viewed at 15,000× magnification, 0.56 nm/pixel). (B) EELS showing a strong cerium (Ce) signal. Arbitrary intensity unit. (C) Ce EFTEM elemental map (viewed at 15,000× magnification). Pre-edge and post-edge were a sum of 12 drift-corrected images. (D) Overlay of the elemental map (green) on the TEM image. (E) TEM image, (F) EELS, (G) Ce-elemental map and (H) overlay of the elemental map (green) on the TEM image of a small miniSOG–Mic19 Ce-DAB-labeled mitochondrion in a HL-1 cell (viewed at 30,000× magnification, 0.28 nm/pixel). A Gaussian smoothing filter of radius 1 pixel, was applied to all images to reduce the noise. All results are representative of n=10 experiments.

