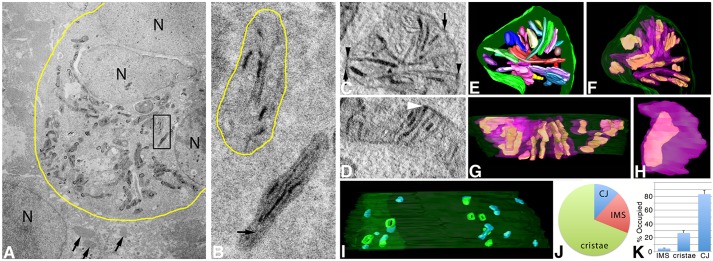
Fig. 4.
ET volumes of Mic19–miniSOG show that it localizes to discrete domains in CJ, IMS and cristae in HL-1 cells. (A) TEM of a cluster of HL-1 cells expressing Mic19–miniSOG. The yellow boundary curve shows the photooxidized region. The mitochondria display dark labeling around their periphery and in the cristae. Outside the photooxidized region, the mitochondria show no dark labeling (arrows) and serve as negative controls. N, nucleus. Results are representative of n=6 cells. (B) Enlarged view of the boxed region in A showing a mitochondrion (bottom) with a relatively dark matrix (arrow points to a portion of the matrix) in contrast to the mitochondrion directly above it with a matrix as light as the surrounding cytoplasm. Here, the OMM (yellow boundary curve) can be deduced by using the labeled cristae and IMS patches as guideposts. In both mitochondria, the cristae labeling is dark. (C) A 1-nm slice through the center of a tomographic volume from a HL-1 cell showing that Mic19-positive domains are at CJs (arrowheads), distributed in the IMS (arrows) and also partially line the intracristal space. Results are representative of n=38 mitochondria. (D) Another example of a slice through the center of a tomographic volume from a different HL-1 cell that has a darkly labeled Mic19-positive domain at a CJ (arrowhead). (E) The segmented and surface-rendered volume of the mitochondrion shown in C. The OMM is green, the cristae are in various colors. HL-1 cells are densely packed with cristae. (F) As in E in the same orientation but showing the Mic19-positive domains (green) in the cristae (translucent magenta) typical of the 38 mitochondrial volumes examined. (G) As in E but in a side orientation showing the Mic19-positive domains extending throughout the cristae. However, the labeled regions never filled the cristae volumes and were in contiguous shapes rather than speckled throughout. (H) A typical Mic19-positive domain inside a crista (translucent magenta) showing that the label filled less than half the crista volume. (I) Side view of the entire complement of CJ (green) and IMS (magenta) Mic19-positive domains. The OMM is translucent. This volume had eight CJs, four of which had openings filled with label and four others did not. The IMS domains not associated with CJs were similar in size to the CJs with no apparent pattern to their distribution. (J) Pie chart showing the distribution of Mic19-positive domains between CJ, IMS and cristae. (K) Histogram showing the percentage of the IMS, cristae or CJ volumes occupied by Mic19-positive domains (mean±s.e.m.). Results are from three biological replicates and 10 total technical replicates (J,K).

