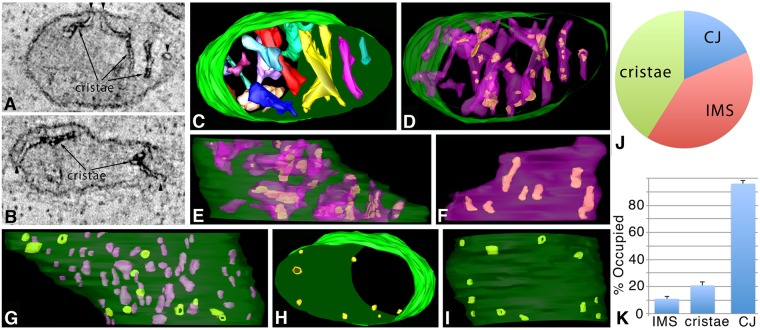
Fig. 6.
ET volumes of Mic60–APEX2 in human primary astrocytes show that it has a distinct localization pattern. (A) A 1-nm slice through the center of a tomographic volume from an astrocyte showing Mic60-positive domains at CJs (arrowheads), discrete patterns in the IMS and a patchy pattern in the intracristal space (arrows). Results are representative of n=6 cells and 39 mitochondria. (B) Another example of a 1-nm slice through the center of a tomographic volume from a different astrocyte having similar Mic60–APEX2 positive domains in the CJ, IMS and cristae. (C) Segmented and surface-rendered volume of the mitochondrion shown in A (OMM green, cristae various colors). (D) The 3D patchy pattern of Mic60-positive domains (green) inside cristae (translucent blue), typical of the 39 mitochondrial volumes examined. (E) Side orientation showing Mic60-positive domains extended throughout the cristae. (F) A crista in this volume showing typical Mic60-positive patches, with seven seen here. (G) IMS (magenta) and CJ (green) Mic60-positive domains. A total of 12 Mic60-positive CJs shown in top (H) and side (I) views in relation to the OMM (translucent green). Five had a clear opening and seven had their openings filled with Mic60 label. (J) Pie chart showing the distribution of Mic60-positive domains between CJ, IMS and cristae. (K) Histogram showing the percentage of the IMS, cristae or CJ volumes occupied by Mic60-positive domains (mean±s.e.m.). Results are from three biological replicates and 10 total technical replicates (J,K).

