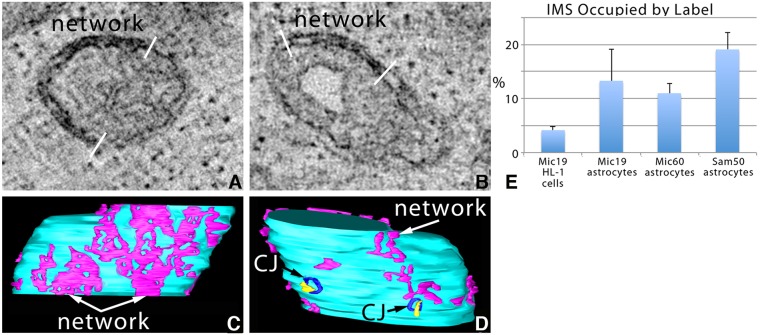
Fig. 7.
ET volume analysis shows that Sam50–APEX2 is only found in the OMM in human primary astrocytes. (A,B) 1-nm slices through the center of tomographic volumes from two separated astrocytes showing that Sam50-positive domains did not extend uniformly around the IMS (bounded by white bars). Results are representative of n=12 cells and 31 mitochondria. (C,D) Opposite sides of the segmented and surface-rendered volume of the mitochondrion shown in A with the IMS (magenta) Sam50-positive network against the background of the IBM (cyan). In D, 2 CJs (blue) overlap with Sam50-positive domains (yellow) in the IMS, but do not have the same shape. (E) Side-by-side comparison of the percent of the IMS volume occupied by the label for all samples examined (mean±s.e.m., n=10 mitochondria from three biological replicates for each population).

