Fig. 1.
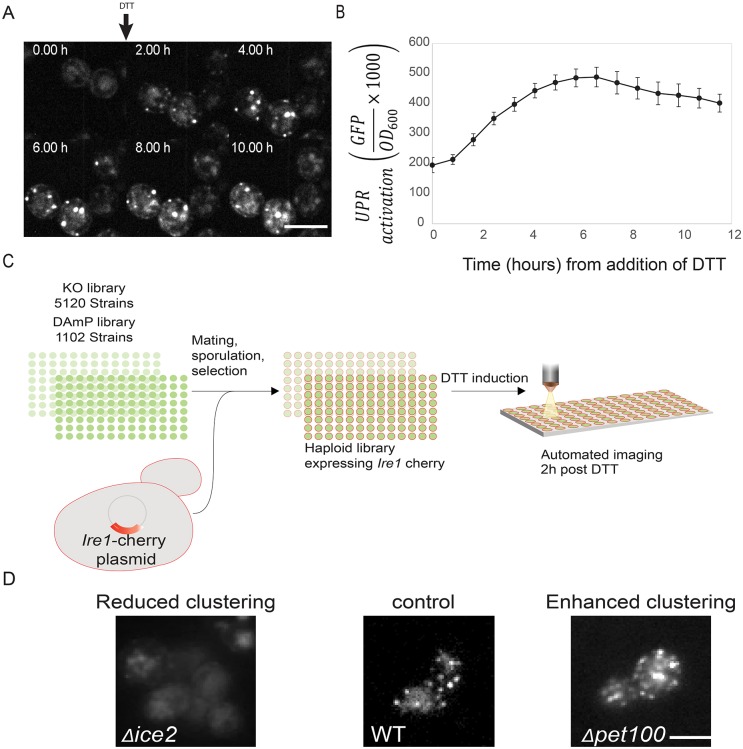
A systematic high-content screen reveals effectors of Ire1 clustering. (A) Ire1–mCherry was visualized over time following induction of the UPR by 2 mM DTT and shows clustering as expected. (B) UPR activity was measured over time using a UPRE-GFP reporter following induction of UPR by 2 mM DTT. UPR activity increases until an activation plateau is reached. Results are mean±s.d. (n=9). (C) Work flow for systematic screen to uncover Ire1–mCherry clustering effectors. (D) Hits from the Ire1–mCherry screen were divided into two phenotypic groups. WT, wild type. Scale bars: 5 μm.

