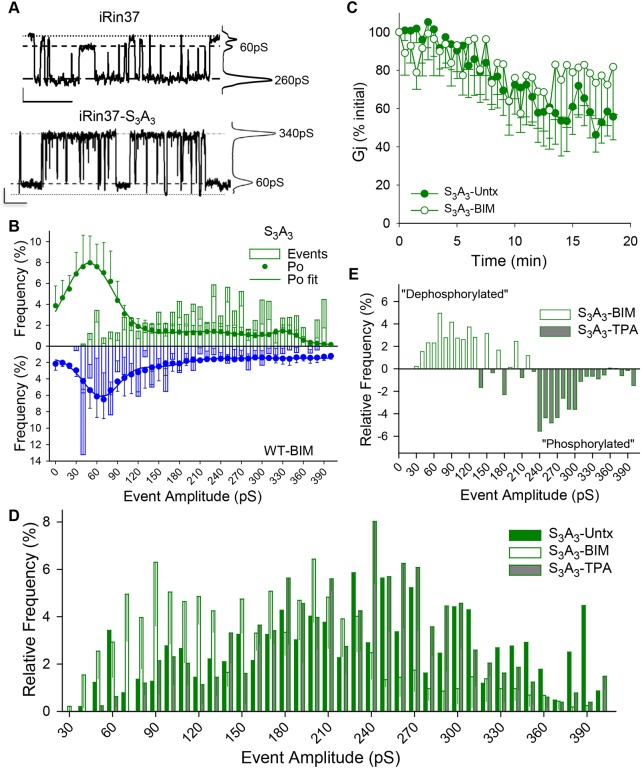
Fig. 3.
Cx37-S3A3 gap junction channel behavior differs from both untreated and BIM-treated Cx37-WT channels and remains PKC sensitive. (A) Single-channel traces and corresponding all-points histograms of Cx37-WT and Cx37-S3A3; Cx37-S3A3 channels transitioned between the fully open state and the 30-90 pS state. Vj=25 mV. Scale bars: 1 s and 2 pA. (B) Combined plots of the relative event and Po frequencies highlight the preference of Cx37-S3A3 channels (green) to transition between the 30-90 pS and larger conductance states, whereas BIM-treated Cx37-WT channels (blue) prefer to transition between the 30-90 pS and closed states. Cx37-S3A3 Po data (n=4; 5.7 min of data) were best fit (R2=0.994) by three peaks: 48 pS, 66%; 209 pS, 31%; 332 pS, 6% (closed state was not fit as a distinct peak); WT-BIM Po fit as in Fig. 1. (C) In iRin37-S3A3 cells, BIM no longer blocks run down of junctional conductance. BIM, n=6; Untx, n=8 (through 14′) and 7 (through 18.5′). (D,E) As with Cx37-WT, PKC inhibition increases the relative frequency of smaller-amplitude events whereas TPA stimulation increases the relative frequency of larger-amplitude events in Cx37-S3A3-expressing cells. Subtracting bin frequency in TPA stimulated (phosphorylated) from PKC inhibited (BIM; dephosphorylated) highlights the effect of PKC-dependent phosphorylation in channel behavior. Vj=25 mV. All values are mean±s.e.m.

