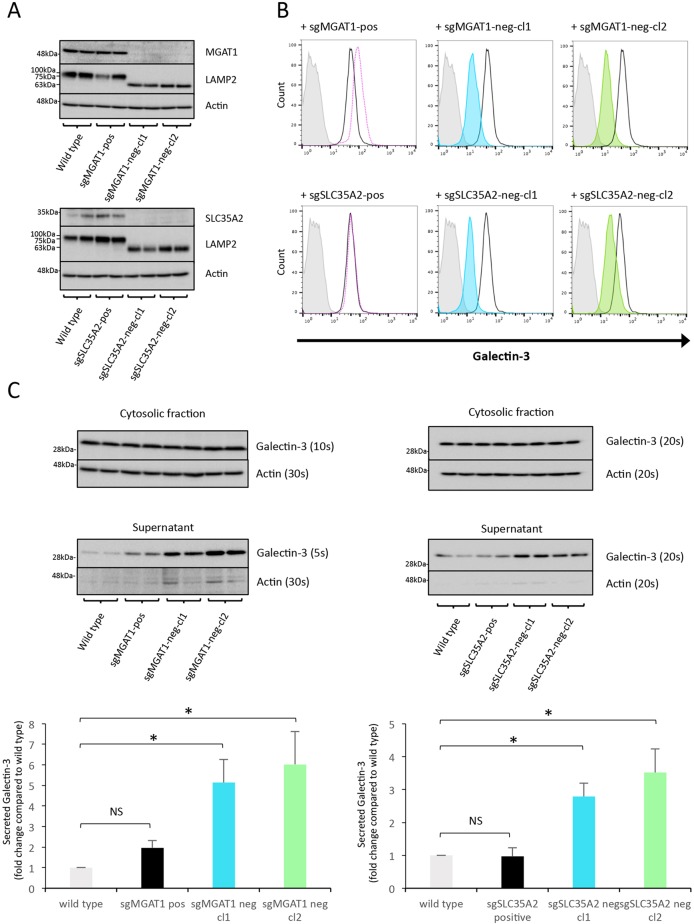
Fig. 3.
MGAT1 and SLC35A2 knockout abrogates Gal-3 cell surface binding but not secretion. (A) Western blot analysis of MGAT1- and SLC35A2-deficient sHeLa. Cell lysates were assessed for either MGAT1 or SLC35A2 protein levels after CRISPR/Cas9 targeting and single cell cloning based on Gal-3 surface expression. LAMP2 was also assessed to analyse defects in glycosylation, and actin was used as a loading control. (B) Cell surface localization of Gal-3 is decreased in MGAT1- and SLC35A2-deficient sHeLa measured by flow cytometry. Cell surface Gal-3 was measured on live cells using an anti-Gal-3 antibody conjugated to Alexa Fluor 647. Grey, no antibody; black line, untransfected; pink dotted line, sgMGAT1-positive clone; blue, sgMGAT1-negative clone 1; green, sgMGAT1-negative clone 2. The same respective colours are used for sgSLC35A2 in the lower panels. (C) Gal-3 is secreted from MGAT1- and SLC35A2-deficient sHeLa. Wild type, positive control and negative clones for MGAT1 (left) and SLC35A2 (right) cells were incubated in serum-free medium for 24 h, and the cells and medium assessed by western blotting. Gal-3 was assessed in the lysate and medium (supernatant); actin was used as a loading control and control for cell lysis. Exposure times are indicated to allow relative comparisons between blots to illustrate the large increase in Gal-3 in the supernatant compared to actin. Quantification of MGAT1 (left) and SLC35A2 (right) is shown in the bottom panels. Data are mean±s.e.m. from biological replicates (n=3); *P<0.05 (two-sample Student's t-test comparing each cell line to wild-type cells). Note that the same actin loading control blots are shown in the top panels of A and C, and also in the top panel of Fig. 5A, as the blots were stripped and reprobed with the indicated antibodies. Similarly, the bottom panel of A and the top panel of Fig. 5B are the same blots.

