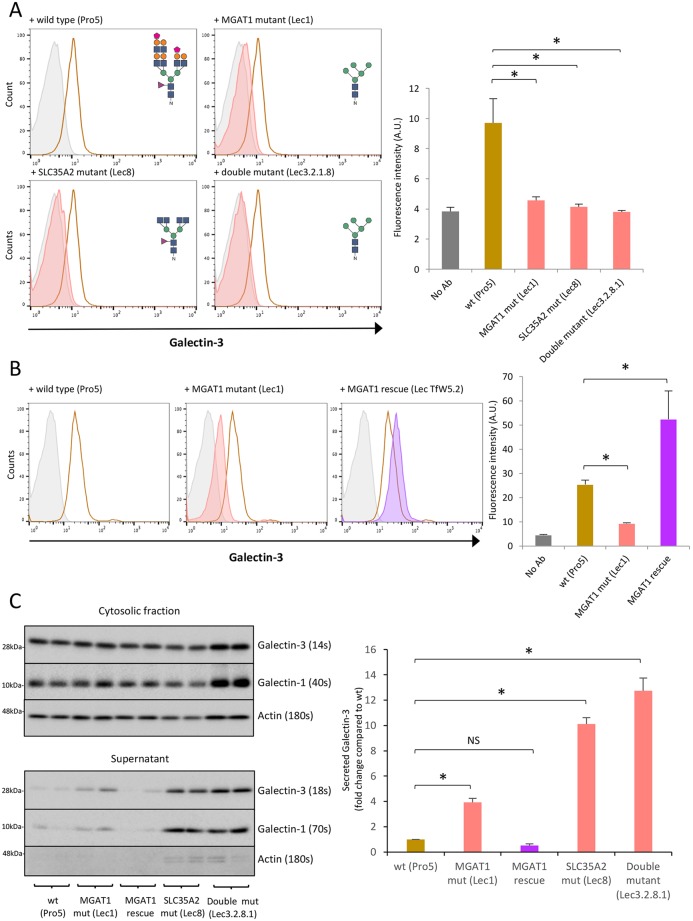
Fig. 4.
MGAT1 and SLC35A2 mutation in CHO Lec cells reduces Gal-3 cell surface binding but does not affect secretion. (A) Gal-3 cell surface localization is decreased in MGAT1 and SLC35A2 mutant CHO lines. Cell surface Gal-3 was measured on live MGAT1 (Lec1), SLC35A2 (Lec8) and double mutant (Lec3.2.1.8) CHO Lec cells compared to wild-type (Pro5) cells by flow cytometry using an anti-Gal-3 antibody conjugated to Alexa Fluor 647. Grey, no antibody; brown, wild type; red, mutants. Predicted N-linked glycans for each cell line are shown on the histograms. Sugar symbols: purple triangle, fructose; green circle, mannose; orange circle, galactose; blue square, N-acetylglucosamine; pink trapezoid, sialic acid. Quantification is shown on the right. Data are mean±s.e.m. from biological replicates (n=3); *P<0.05 [two-sample Student's t-test comparing each mutant CHO line to wild-type (Pro5) cells]. (B) Gal-3 cell surface localization is rescued in MGAT1 rescue CHO Lec cells measured by flow cytometry. Gal-3 was measured as in A. Grey, no antibody; brown, wild type; red, mutants; purple, rescue. Quantification is shown on the right. Data are mean±s.e.m. from biological replicates (n=3); *P<0.05 [two-sample Student's t-test comparing the MGAT1 mutant and rescue lines to wild type (Pro5) cells]. (C) Gal-3 is secreted from MGAT1 and SLC35A2 mutant CHO Lec cells. Wild-type (Pro5), MGAT1 (Lec1), MGAT1 rescue, SLC35A2 mutant (Lec8) and the double mutant (Lec3.2.8.1) were incubated in EX-CELL 325 PF CHO for 48 h, and the cells and medium assessed by western blotting. Gal-3, Gal-1 and actin were analysed in the cell lysates and medium (supernatant). Exposure times are indicated for comparison. Quantification is shown on the right. Data are mean±s.e.m. from biological replicates (n=3); *P<0.05 [two-sample Student's t-test comparing each mutant CHO cell line to wild-type (Pro5) cells].

