Fig. 5.
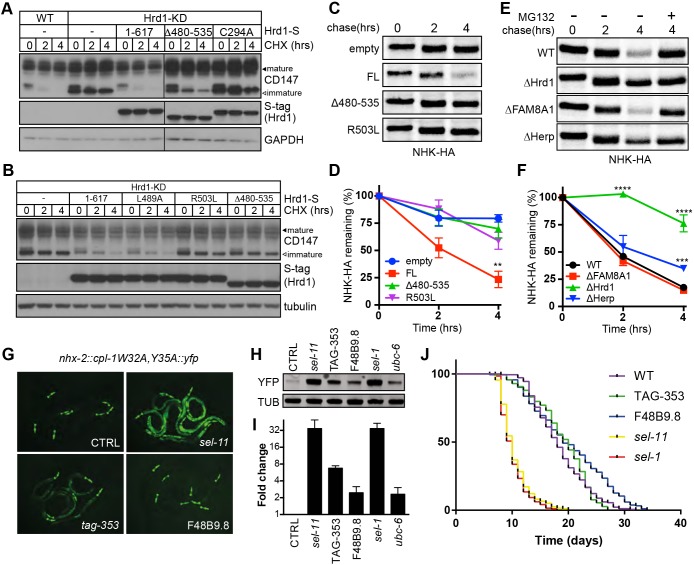
The cytoplasmic interaction domain underlies Hrd1-dependent ERAD. (A) Degradation of CD147 monitored by CHX chase (0, 2, 4 h; 10 μg/ml) and western blotting in Flp-In T-REx 293 cells, and HEK293Flp-In/Hrd1-KD cells stably reintroduced with S-tagged Hrd1 variants. Lysates of LMNG-solubilised post-nuclear fractions were separated by SDS-PAGE and the resulting blots probed with antibodies against CD147 and Hrd1 (S-tag). Black arrowheads indicate the immature, ER-localised form of CD147 while asterisks designate the post-ER, mature forms. (B) Degradation of CD147 monitored in HEK293Flp-In/Hrd1-KD cells expressing Hrd1 mutants (L489A, R503L). (C) Representative 35S-Met/Cys pulse-chase assays (0, 2 and 4 h) of the HA-tagged ERAD substrate NHK-HA expressed in HEK293FlpIn/Hrd1-KD cells with or without DOX-induced expression of Hrd1-S (empty, FL, Δ480-535 or R503L). Radiolabelled substrates immunoprecipitated from 1% Triton X-100 lysates by anti-HA were separated by SDS-PAGE. (D) Quantification of biological replicates in C. Band intensities quantified by phosphorimaging (BioRad) were normalised to values at t=0 h. Results are presented as mean±s.e.m. for each (n=3). Significance as determined by Students t-test is shown. **P≤0.01. (E) Representative 35S-Met/Cys pulse-chase assays of NHK-HA transiently expressed in Flp-In T-REx 293 cells WT, ΔHrd1, ΔFAM8A1 and ΔHerp cells. Samples were collected and processed as in C. (F) Quantification of biological replicates in E. Band intensities quantified by phosphorimaging were normalised to values at t=0 h. Mean±s.e.m. are plotted for each (n=3). Significance as determined by Students t-test is shown. ***P≤0.001, ****P≤0.0001. (G) Fluorescence images of the ERAD-substrate CPL-1W32A,Y35A-YFP in C. elegans disrupted for Hrd1 (sel-11), Herp (tag-353) or FAM8A1 (F48B9.8). (H) Western blot of CPL-1W32A,Y35A-YFP and tubulin from the mutants of Hrd1 complex. (I) Quantification of band intensities from I. Displayed as fold-change in YFP or tubulin with mean±s.e.m. are shown for each (n=3). (J) Kaplan–Meyer survival curves of Hrd1 complex mutant worms. Calculated mean lifespans are: WT, 18.5 days; cup-2 and tag-353 (gk443)l, 18.9 days; F48B9.8 (gk272969), 20.2 days; sel-11 (nDf59) V, 10.5 days; sel-1 (e1948)V, 10.1 days. Raw data from biological replicates (n=4) is presented in Table S4.

