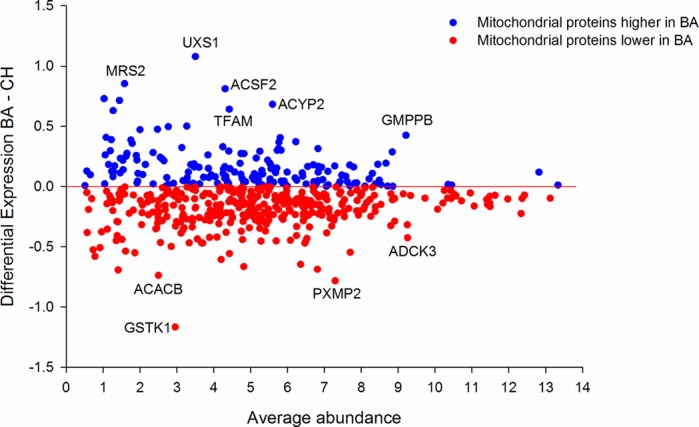
Fig. 2.

mRNA encoding the mitoproteome. Overlaying the mRNA encoding the mitoproteome onto the 260 days MA plot illustrates a significant skew towards the CH, consistent with the expectation of lower oxidative capacity in the fast, glycolytic musculature of the BA.
