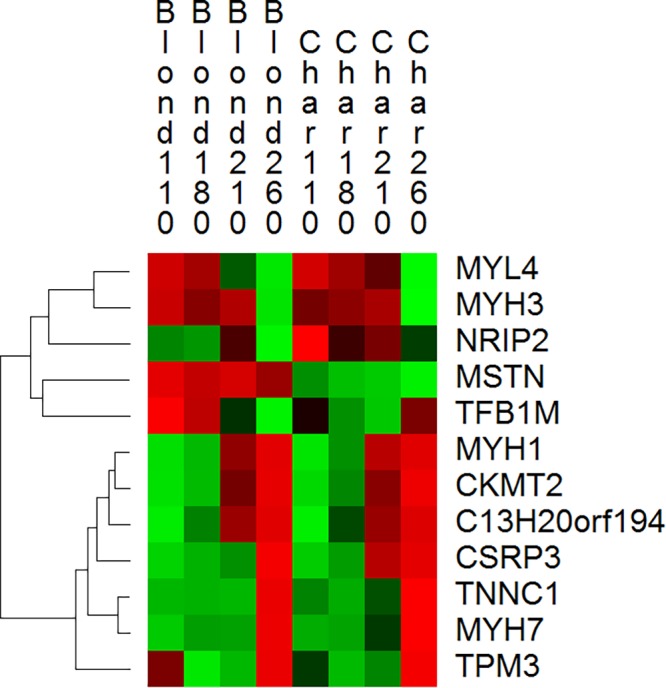
Fig. 4.

A hierarchically clustered heat map of normalized mean expression values with treatments as columns and genes as rows. The genes selected for hierarchical clustering have been emphasized in this manuscript because of high developmental regulation (MYL4, MYH3, C13H20ORF194, CKMT2 and MYH1), high DE between the breeds (TPM3, MYH7, TNNC1, CSRP3, MSTN) or high DC between the breeds (MSTN, NRIP2 and TFB1M). Red represents high expression and green represents low expression. A number of tight co-expression relationships are apparent, including that of TNNC1, TPM3 and MYH7, all of which encode contractile subunits predominantly expressed in slow twitch fibres.
