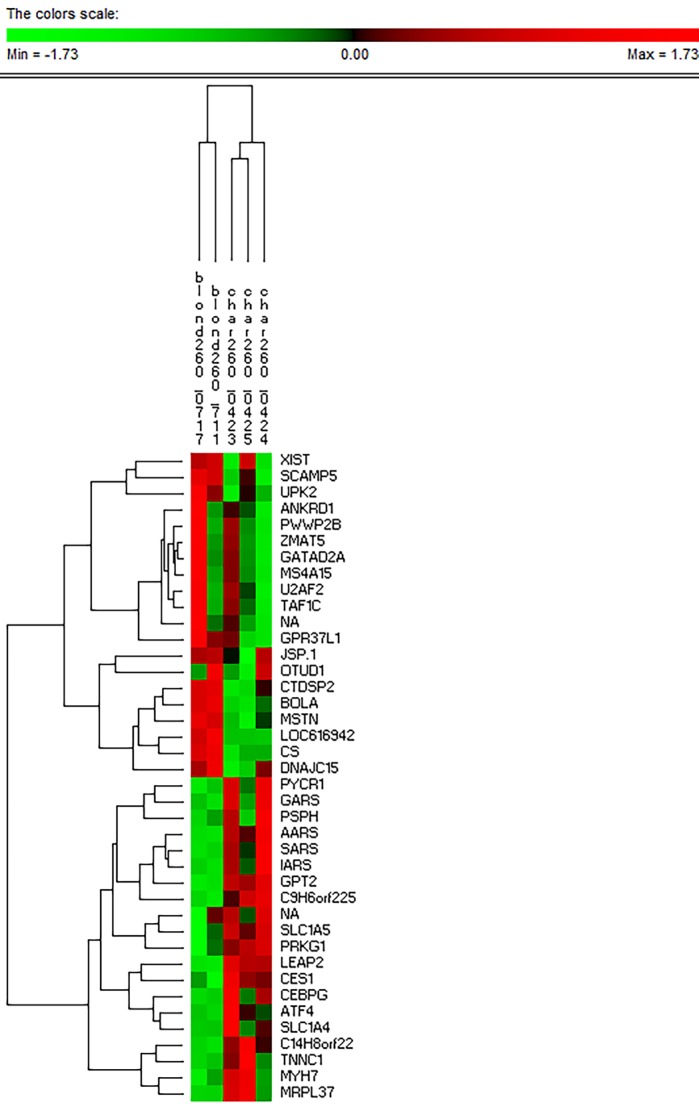
Fig. 5.

The hierarchically-clustered heatmap for the individual normalized mean expression values for the 40 most differentially expressed genes between BA and CH at d260. This panel of 40 DE genes is able to correctly cluster the individual samples into the appropriate breed treatment group at this time point. This suggests that the treatment means we used as the basis for much of the analysis are reasonable representations of the full data set.
