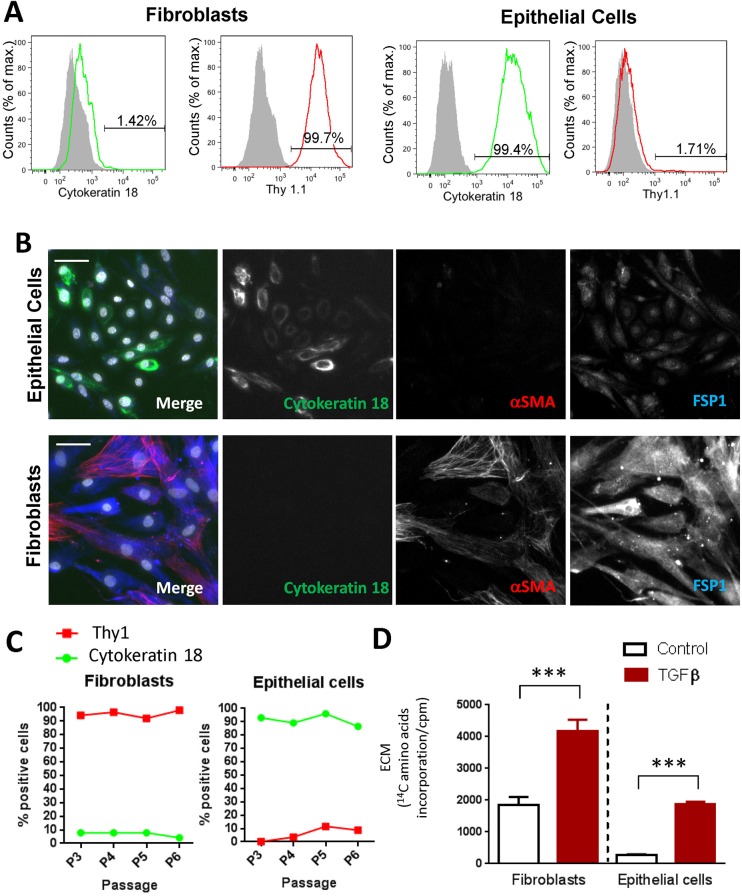
Fig. 1.
Phenotypic characterisation of primary human tubular epithelial cells and human renal fibroblasts. (A) Flow cytometric analysis of cytokeratin18 and Thy1.1 staining in primary human epithelial cells and fibroblasts. Grey shading indicates unstained cells. (B) Immunofluorescence staining of fibroblasts and epithelial cells for FSP1 (blue), α-smooth muscle actin (red) and cytokeratin 18 (green). Scale bars: 50 µm. (C) Flow cytometric analysis of cytokeratin and Thy1 expression on fibroblasts and epithelial cells over increasing passage number. (D) Accumulation of total extracellular matrix produced by fibroblasts and epithelial cells cultured for 6 days with or without stimulation using 10 ng/ml TGFβ1 in the presence of 14C amino acids. Cells were stripped and extracellular matrix accumulation was measured by scintillation counting. Graph shows data from five independent experiments with at least four replicates per experiment, statistical analysis performed on means from independent experiments, error bars indicate mean±s.e.m.; ***P<0.001, paired t-test performed on means from independent experiments.

