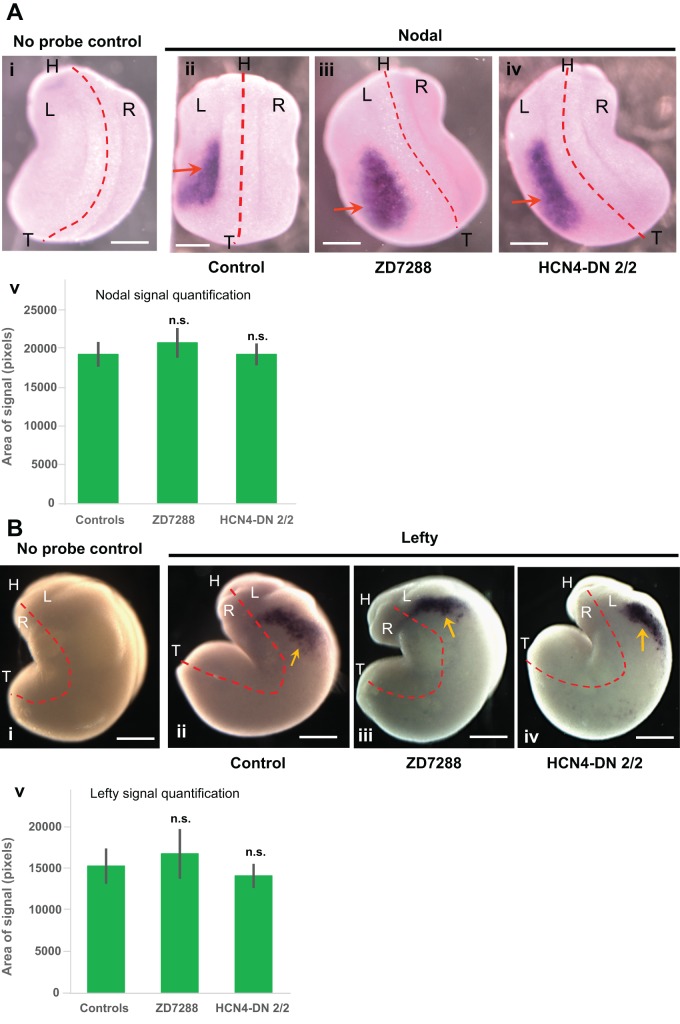
Fig. 4.
Localization of the asymmetric gene Xnr-1 (nodal) is not affected by HCN4-DN and ZD7288. (A) Representative images of approximately stage 21 embryos assayed for Xnr-1 (nodal) expression by in situ hybridization and quantification of area of nodal expression. Red dotted line is midline and L representing left-side, R representing right-side, H representing head and T representing tail of embryos. Scale bar: 0.25 mm. (i) No probe (negative) untreated control, (ii) control embryos with Xnr-1 signal – red arrow, (iii) ZD7288-treated (from stage 1-10) embryos with Xnr-1 signal – red arrow, (iv) HCN4-DN mRNA injected (in both blastomeres at 2-cell stage) embryos with Xnr-1 signal – red arrows, and (v) quantification of area of Nodal expression in embryos showed no significant change in the area of Nodal expression in HCN4-DN mRNA-injected and ZD7288-treated embryos. N>10; data was analyzed by one-way ANOVA; n.s., non-significant. (B) Representative images of approximately stage 23 embryos assayed for Lefty expression by in situ hybridization and quantification of area of lefty expression. Red dotted line is midline and L representing left-side, R representing right-side, H representing head and T representing tail of embryos. Scale bar: 0.25 mm. (i) No probe (negative) untreated control, (ii) control embryos with Lefty signal – yellow arrow, (iii) ZD7288-treated (from stage 1-10) embryos with Lefty signal – yellow arrow, (iv) HCN4-DN mRNA-injected (in both blastomeres at 2-cell stage) embryos with Lefty signal – yellow arrows, and (v) quantification of area of Lefty expression in embryos showed no significant change in the area of Lefty expression in HCN4-DN mRNA-injected and ZD7288-treated embryos. N=10; data was analyzed by one-way ANOVA; n.s., non-significant.

