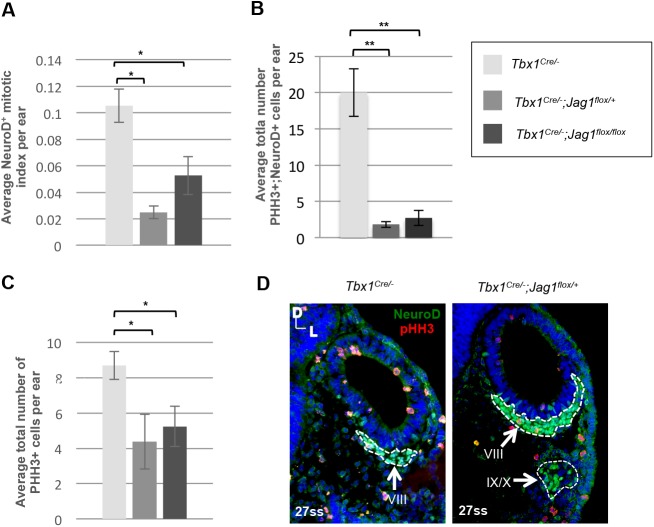
Fig. 5.
An increased number of NeuroD+ cells is unaccompanied by changes in neuroblast proliferation in Tbx1Cre/−;Jag1flox/+ and Tbx1Cre/−;Jag1flox/flox mutants at E9.5. (A) Bar graphs plotting the mean mitotic index per ear within the neuroblast population as defined by NeuroD expression. Mitotic index was calculated by dividing the total number of proliferating cells (pHH3+) that colocalized with NeuroD by the total number of NeuroD+ cells. Values were markedly lower in Tbx1Cre/−;Jag1 flox/+ and Tbx1Cre/−;Jag1 flox/flox OVs and the differences reached statistical significance. (B) Bar graphs plotting the mean total number of pHH3+ cells in the OV within NeuroD+ domain per OV. Values were statistically significantly lower in Tbx1Cre/−;Jag1 flox/+ and Tbx1Cre/−;Jag1 flox/flox OVs compared to Tbx1Cre/− OVs. (C) Bar graphs plotting the mean total number of pHH3+ cells in the OV outside the NeuroD+ domain per OV. Values were statistically significantly lower in Tbx1Cre/−;Jag1 flox/+ and Tbx1Cre/−;Jag1 flox/flox OVs compared to Tbx1Cre/− OVs. (D) Examples of the dual immunofluorescence experiment using antibodies to NeuroD and pHH3, used to calculate the above data. There are visibly fewer proliferating cells throughout the OV of Tbx1Cre/−;Jag1 flox/+ embryos compared to Tbx1Cre/ embryos. The VIIIth ganglion/CVG is markedly larger in Tbx1Cre/−;Jag1 flox/+ mutants compared to Tbx1Cre/− mutants. A distinct portion of the fused distal epibranchial ganglia (IX/X) is also outlined below. Note: three embryos and six OVs per genotype were used for each group. Embryos were stage-matched at 27ss. Data are mean±s.e.m. *P<0.05; **P<0.005.

