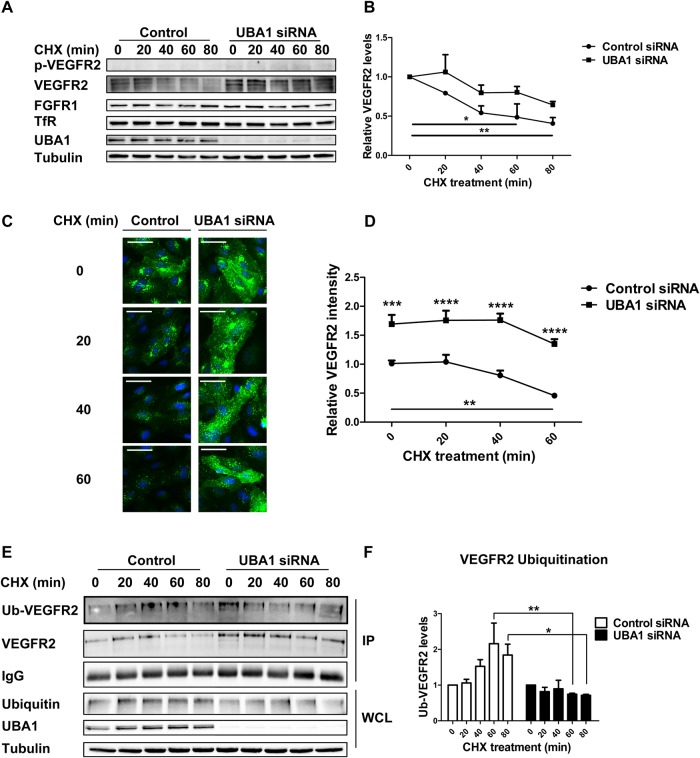
Fig. 2.
UBA1 regulates basal VEGFR2 degradation. (A) HUVECs transfected with non-targeting or UBA1 siRNA were treated with 20 µg/ml cycloheximide (CHX) over a time course of 80 min and immunoblotted using antibodies to phospho-VEGFR2 (pY1175), VEGFR2, FGFR1 and TfR. (B) Quantification of VEGFR2 levels in HUVECs transfected with non-targeting control siRNA or UBA1-specific siRNA combined with 20 µg/ml CHX treatment for 0-80 min presented as decay curves. (C) HUVECs transfected with non-targeting control siRNA or UBA1-specific siRNA were treated with 20 µg/ml CHX over a time course of 0-60 min and visualized using immunofluorescence microscopy by staining with antibodies to VEGFR2 followed by fluorescent species-specific secondary antibodies (green). Nuclei were stained with DNA-binding dye, DAPI (blue). Scale bar: 200 μm. (D) Quantification of VEGFR2 staining from the immunofluorescence microscopy data shown in panel C presented as decay curves. (E) Primary human endothelial cells transfected with non-targeting control siRNA or UBA1-specific siRNA were treated with 20 µg/ml CHX (0-80 min), lysed and VEGFR2 immuno-isolated and probed for ubiquitination status using a ubiquitin-specific antibody. (F) Quantification of ubiquitinated VEGFR2 (Ub-VEGFR2) levels in endothelial cells from the isolation and immunoblotting experiments shown in panel E. Relative Ub-VEGFR2 levels were normalized using total IgG and VEGFR2. IP, immunoprecipitate; WCL, whole cell lysate. In panels B, D, E and F, error bars denote mean±s.e.m. (n≥3), with significance denoted as *P<0.05, **P<0.01, ***P<0.001; analysed by two-way ANOVA.

