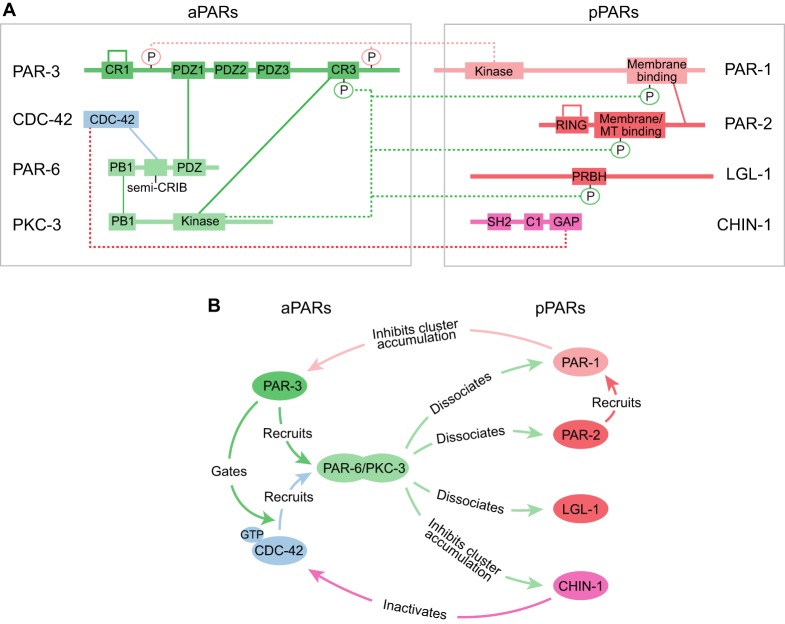
Fig. 2.
Core molecular interactions that underlie the dynamic stabilization of PAR asymmetries. (A) A schematic view of the PAR network indicating key domains and phosphorylation sites involved in protein-protein interactions. Solid lines indicate direct binding interactions, whereas dotted lines terminating in circles represent enzymatic action, either phosphorylation or GAP activity. In the case of PAR-3 and PAR-2, self-connecting loops indicate oligomerization. (B) A functional view of the same circuit emphasizing the consequences of protein-protein interactions. For clarity, some interactions documented in other contexts (e.g. inhibition of aPKC by LGL or by PAR-3) have been omitted here.

