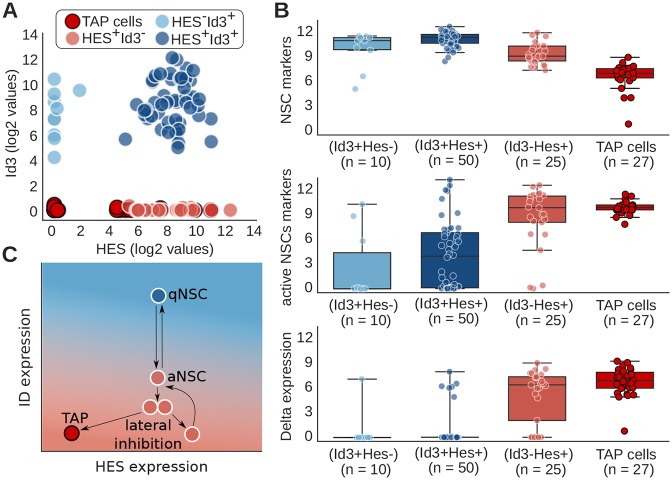
Fig. 5.
Expression pattern of adult NSCs at the single-cell level and mechanistic interplay between Notch/Hes and IDs. (A) Single cells from adult murine brain are represented based on their levels of Hes (Hes1, Hes5) and Id3 (Llorens-Bobadilla et al., 2015). Color code represents three subpopulations of NSCs: Id3+Hes−, Id3+Hes+ and Id3−Hes+; and transient amplified progenitors (TAP) cells. (B) Expression level of NSC markers (Slc1a3, Nr2e1, Sox9, Vcam1), active NSC/progenitor markers (Ascl1, Fos, Egr1, Sox4, Sox11) and Delta ligands (Dll1, Dll3, Dll4) for different populations of NSCs and TAP cells. NSC markers and active NSC/progenitor markers were chosen based on the analysis of the expression profile of adult NSCs (Llorens-Bobadilla et al., 2015). (C) Schematic representation of adult neurogenesis based on the modeling presented in Fig. 4D and on experimental results presented in B. High levels of IDs drive NSC quiescence. By decreasing IDs, the NSC become proliferative and stimulate the expression of the Notch ligand Delta. Notch-Delta lateral inhibition segregates neighboring active NSCs into high and low Notch signal. While the NSC with low Notch differentiates into a TAP cell, the NSCs with high Notch remain proliferative and can go another round of differentiation. Similar results are found using Id2 instead of Id3, or considering all IDs (Id1-Id4) together, and for an alternative choice of NSC and proliferative markers (Figs S5-8).

