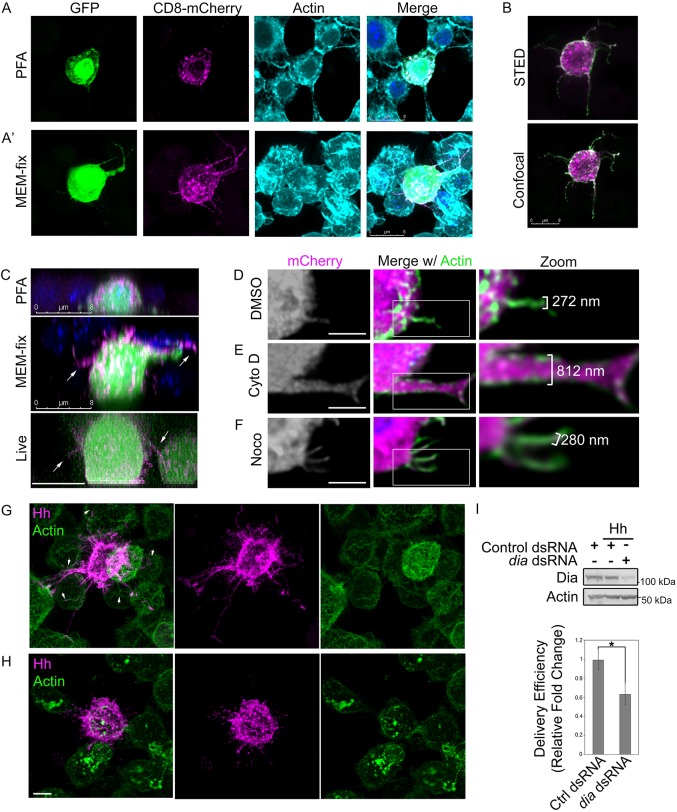
Fig. 1.
MEM-fix preserves cultured cell cytonemes. (A,A′) S2 cells expressing GFP and CD8-mCherry were fixed in 4% PFA (A) or MEM-fix (A′) and stained with phalloidin to label actin. (B) S2 cells expressing Hh (green) and CD8-mCherry (magenta) were MEM-fixed, immunostained for Hh and imaged by STED and confocal microscopy. (C) z-stack images of S2 cells expressing GFP and CD8-mCherry were collected from PFA-fixed, MEM-fixed and live cells. DAPI is shown in blue in fixed samples. (D-F) S2 cells expressing cytoplasmic mCherry were plated and treated with DMSO vehicle (D), 10 µm cytochalasin D (E) or 10 µm nocodazole (F) for 1.5 h prior to processing for imaging. Phalloidin (green) marks actin. (G,H) Hh-expressing cells were cultured with non-expressing cells. Hh puncta (magenta) are evident in non-expressing neighboring cells contacted by Hh-positive filopodia (arrowheads). Phalloidin (green) marks actin. (I) More than 60 cells per condition were analyzed over three independent experiments to determine average Hh delivery efficiency to non-expressing cells in contact with a cytoneme. Significance was determined using a two-tailed Student's t-test (*P≤0.05). Error bars indicate s.e.m. Lysates from dsRNA-treated cell populations are shown to confirm Dia knockdown. Actin is the loading control. Scale bars: 8 µm (A-C); 5 µm (D-H).

