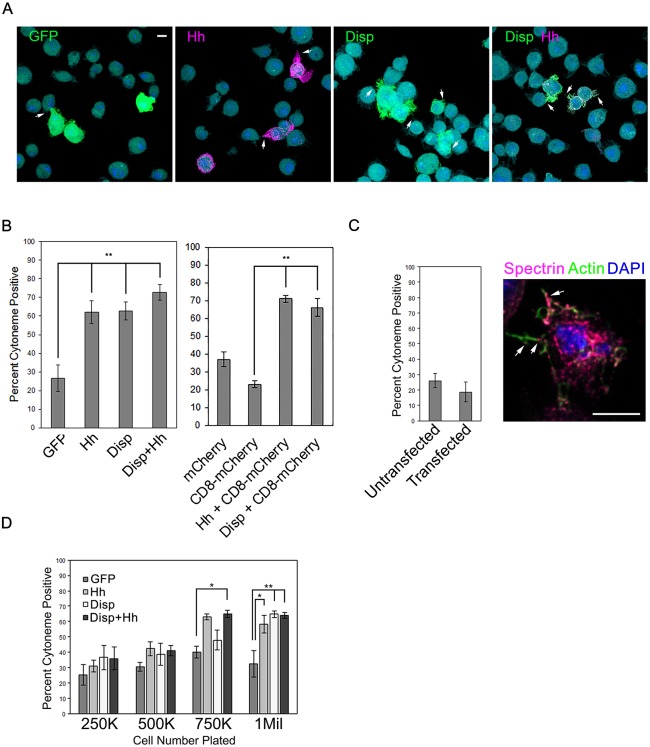
Fig. 3.
Disp and Hh increase cytoneme occurrence. (A,B) S2 cells were transfected with vectors encoding the indicated proteins, and cytoneme occurrence (arrows) in transfected cells was quantified. Statistical significance was determined using a one-way ANOVA (**P≤0.01). Representative fields of cells are shown in A. Approximately 150 transfected cells were counted per condition across three independent experiments. (C) Cytoneme occurrence was quantified in untransfected S2 cells and S2 cells transfected with empty pAc5.1 vector. Cytonemes were identified by actin (green) and the membrane protein α-Spectrin (magenta, arrows). Percentage of cytoneme occurrence was calculated for approximately ∼150 cells per condition across three separate experiments, and all data were pooled. (D) Cells were plated at increasing densities and cytoneme occurrence was quantified. Approximately 75 cells per condition were counted. The experiment was repeated three times and all data pooled. Significance was determined using a two-way ANOVA (*P≤0.05, **P≤0.01). Error bars indicate s.e.m. Scale bars: 5 µm.

