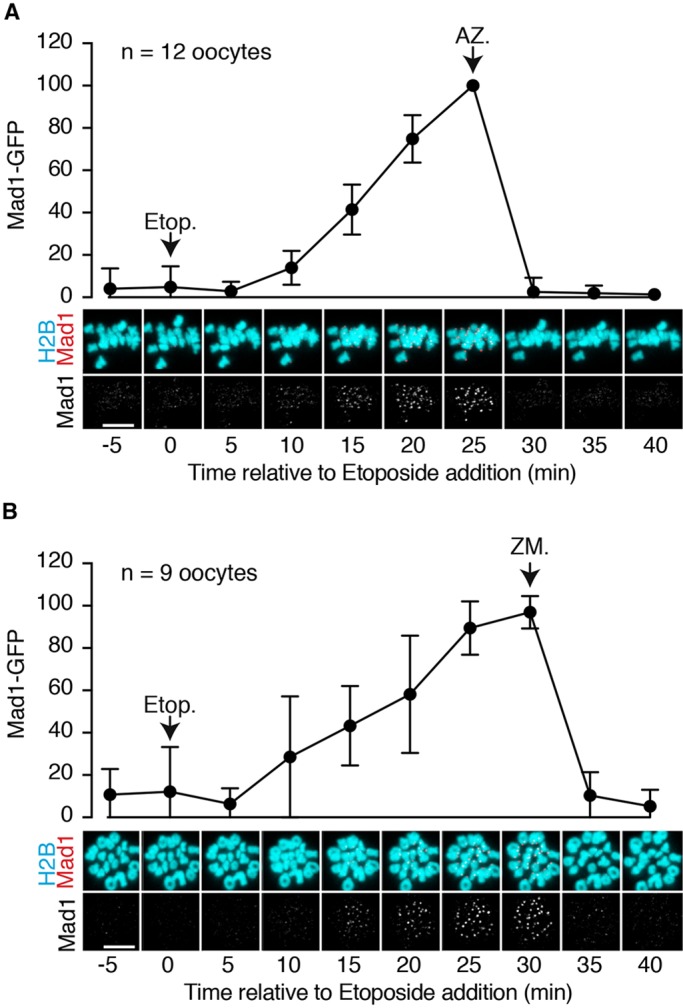
Fig. 3.

Recruitment of Mad1 following DNA damage requires Mps1 and aurora kinase activity. (A,B) Bivalents from oocytes expressing Mad1-GFP and H2B-mCherry were tracked in MI by responsive time-lapse imaging with images recorded every 5 min. Representative images showing Mad1 and H2B with etoposide addition, followed by either AZ3146 (A) or ZM447439 (B). The Mad1 signal is quantified above the corresponding images, normalised to the maximum signal. Scale bars: 10 µm. Error bars indicate s.d.
