
Fig. 5.
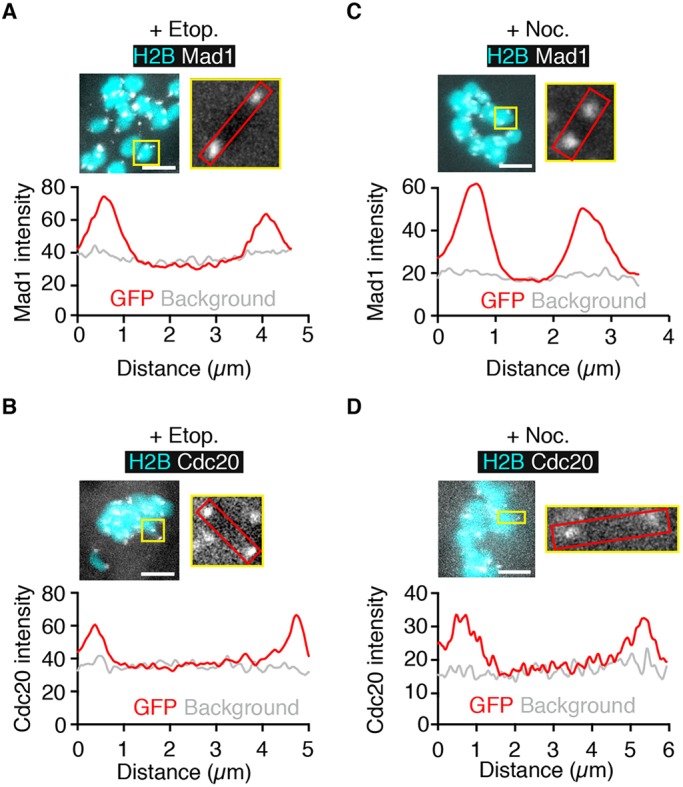
SAC proteins form discrete foci at centromeres following DNA damage. (A-D) Mad1-GFP (A,C) or Cdc20-GFP (B,D) fluorescence in oocytes co-expressing H2B-mCherry 1 h after addition of etoposide (A,B) or nocodazole (C,D). Images on the right show higher magnification of a representative bivalent (yellow box), for which Mad1 or Cdc20 intensity is plotted along the axial length of the bivalent in the graph below. Background readings were taken from a nearby area containing no chromosomes. For all plots Mad1 and Cdc20 fluorescence is only located in the centromeric region of the mouse telocentric bivalents. Scale bars: 5 µm.