Fig. 2.
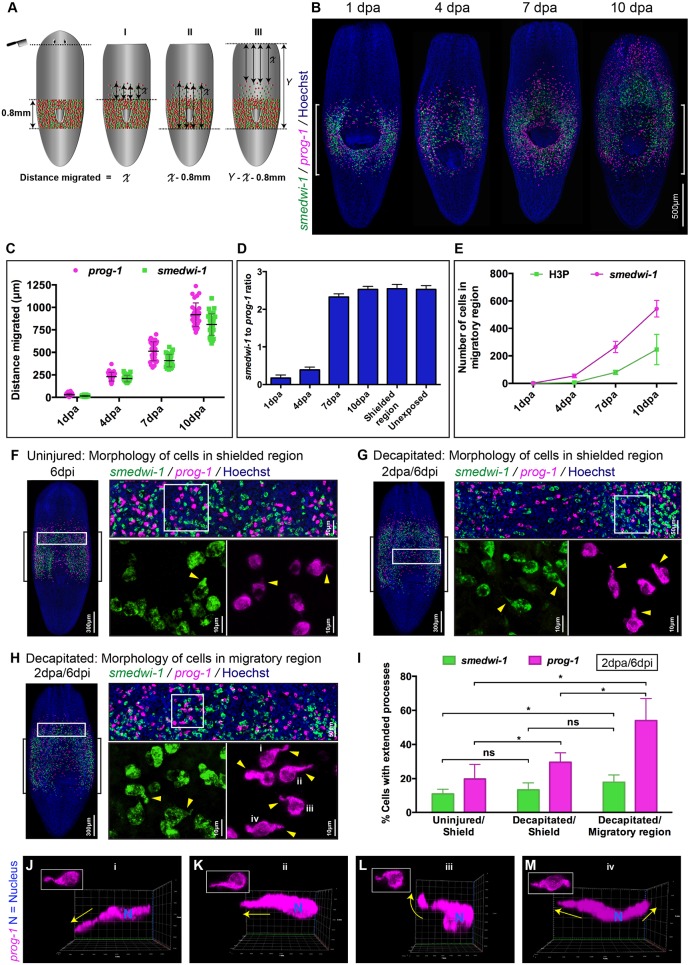
Wound-induced cell migration and characteristic extended morphology of migrating stem cells and stem cell progeny. (A) Model demonstrating the position of the wound and three (I, II and III) independent methods for measuring migration distances. (B) Representative WFISH showing NBs (green) and progeny (magenta). Brackets indicate the shielded area. (C) Distances migrated during migration and repopulation of NBs (green) and early progeny (magenta) after shielding across the pharynx at 1, 4, 7 and 10 days post injury (dpa). Each dot represents the average distance migrated by the ten most distal cells in each animal (n=20 per time point). (D) NB to early progeny ratio in the migratory region at 1, 4, 7 and 10 dpa (decapitation) (n=20 per time point). Ratio of cells in the shielded region and in unexposed worms is used as a control. Mean±s.d. (E) Quantification of NBs (magenta) and mitotic cells (green) in the migratory region following decapitation at 1, 4, 7 or 10 days (n=20 per time point). Mean±s.d. H3P, H3ser10p. (F-H) Morphology of cells within the shielded region in an uninjured worm (F), within the shielded region in a decapitated worm (G) and within the migratory region in the decapitated worm (H) shows NBs (green) and early progeny cells (magenta) with and without extended cytoplasmic projections (n=20 in each condition). Brackets indicate the shielded area. Arrowheads indicate examples of extended processes. (I) Quantification of cells with processes shows an increase in the number of NBs (green) and early progeny (magenta) with extended processes within the decapitated/migratory region as well as the decapitated/shielded region compared with the uninjured/shielded region (n=20 per condition). Mean±s.d. Student's t-test, *P<0.05; ns, not significant. (J-M) Early progeny cells (magenta) within the migratory region in decapitated worms (i-iv in H, boxed) show extended processes in various directions relative to the wound. Arrows indicate the direction of extended processes. Relative position of wound to cells is to the top. J-M and i-iv are the same cells: i-iv, top views; J-M, side views. See also Fig. S2.

