Fig. 6.
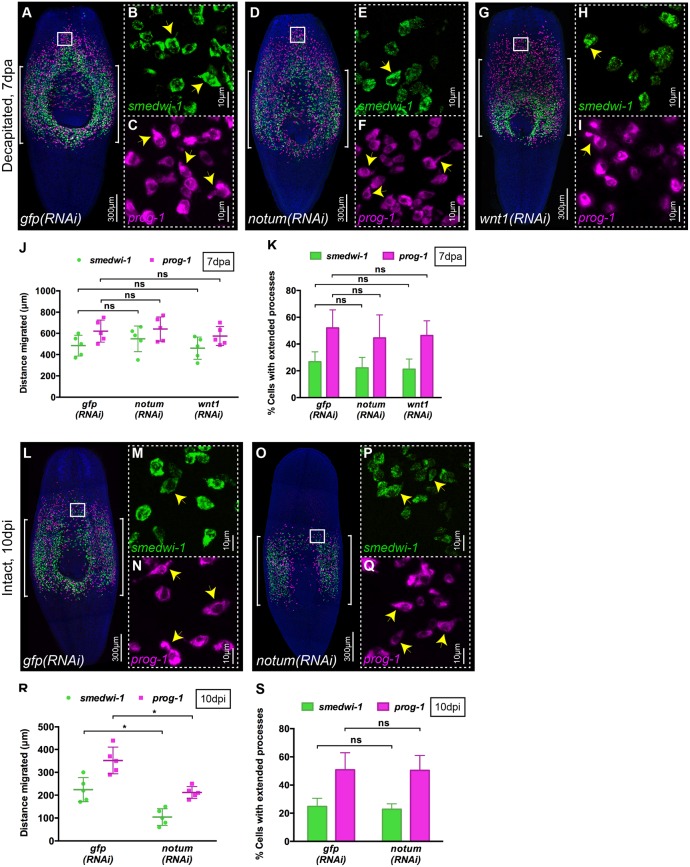
notum is required for migration in the absence of wounding. (A-I) WFISH showing migration of NBs (green) and early progeny (magenta) at 7 dpa in (A-C) control gfp(RNAi), (D-F) notum(RNAi) and (G-I) wnt1(RNAi) animals. Brackets indicate the shielded area. Insets show that NBs and early progeny in the migratory region from (B,C) gfp(RNAi), (E,F) notum(RNAi) and (H,I) wnt1(RNAi) animals are able to form extended processes (arrowheads). (J) Distances migrated by NBs (green) and early progeny (magenta) at 7 dpa in gfp(RNAi), notum(RNAi) and wnt1(RNAi) animals are equal (n=5). Each dot represents the average distance migrated by the ten most distal cells from each animal. Mean±s.d. Student's t-test. (K) Number of NBs and early progeny with extended processes in notum(RNAi), wnt1(RNAi) and gfp(RNAi) animals (n=5). Mean±s.d. Student's t-test. (L-Q) WFISH showing migration of NBs (green) and early progeny (magenta) at 10 dpi in intact (O-Q) notum(RNAi) animals compared with intact (L-N) gfp(RNAi) animals. Brackets indicate the shielded area. (M,N,P,Q) The morphology of NBs and early progeny in the migratory region. Arrowheads indicate examples of cells with extended processes. (R) Distance migrated by NBs (green) and early progeny (magenta) at 10 dpi in notum(RNAi) animals compared with gfp(RNAi) animals (n=5). Each dot represents the average distance migrated by the ten most distal cells from each animal. Mean±s.d. Student's t-test, *P<0.05. (S) Quantification of extended processes of NBs and early progeny in notum(RNAi) compared with gfp(RNAi) animals (n=5). Mean±s.d. Student's t-test. See also Fig. S4.

